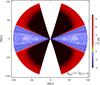
Fig. 3
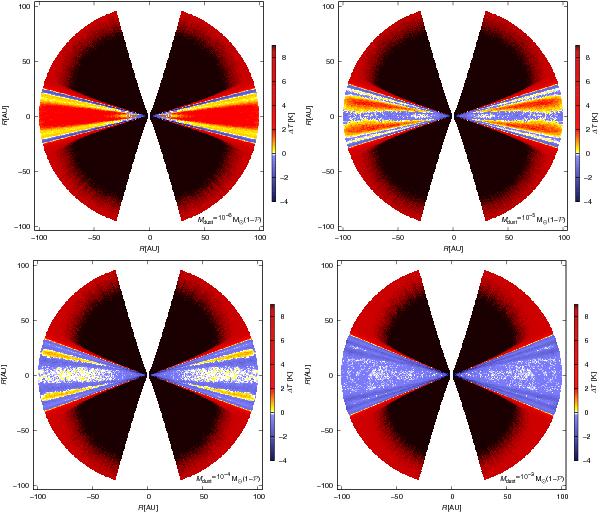
Difference maps of the dust temperature distributions in the plane perpendicular to the midplane. The absolute difference indicates the temperature deviations of the disks of compact spheres and porous grains,  , for
, for  , 10-5, 10-4, and 10-3, respectively. Yellow-red color code: Compact spheres are warmer, blue: Porous grains are warmer.
Current usage metrics show cumulative count of Article Views (full-text article views including HTML views, PDF and ePub downloads, according to the available data) and Abstracts Views on Vision4Press platform.
Data correspond to usage on the plateform after 2015. The current usage metrics is available 48-96 hours after online publication and is updated daily on week days.
Initial download of the metrics may take a while.