Fig. 8
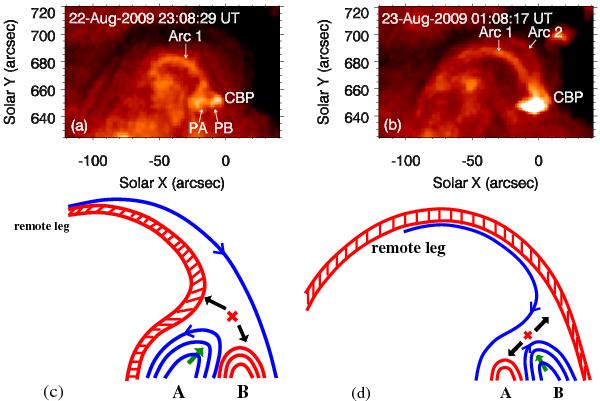
Top panels: SXR images of the CBP event observed a) at 23:08 UT on August 22 and b) at 01:08 UT on August 23. “Arc 1”, “Arc 2”, PA, PB, and CBP have the same meanings as in Fig. 5. Bottom panels: cartoons that illustrate c) the weak and d) strong flash phases of the CBP event. The solid blue/red lines represent magnetic field lines in the inflow/outflow regions. The red crosses denote the X-point of the reconnection region. The black arrows point to the direction of mass motion. A and B stand for the magnetic field lines in the two patches of the CBP.
Current usage metrics show cumulative count of Article Views (full-text article views including HTML views, PDF and ePub downloads, according to the available data) and Abstracts Views on Vision4Press platform.
Data correspond to usage on the plateform after 2015. The current usage metrics is available 48-96 hours after online publication and is updated daily on week days.
Initial download of the metrics may take a while.