Free Access
Fig. 7
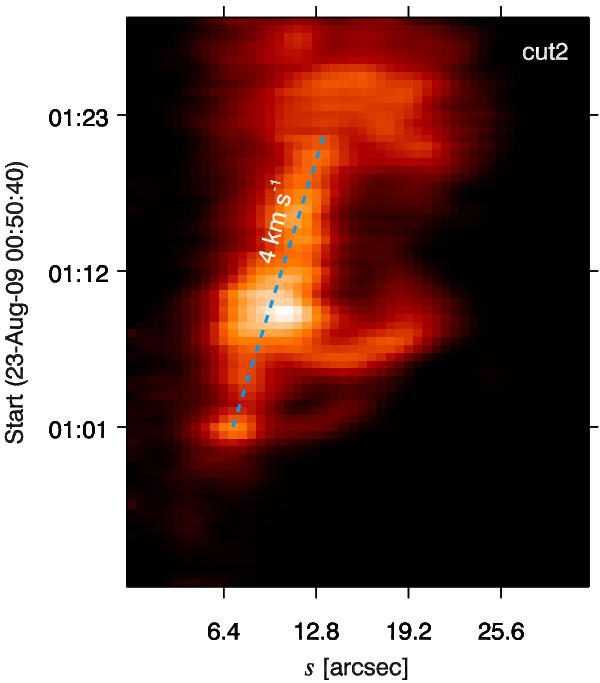
Time-slice diagram of the SXR intensity along cut2 during the strong-flash phase. The dashed blue line stands for the rightward drift of “Arc 1”. The slope of the blue line represents the apparent drift speed (4 km s-1).
Current usage metrics show cumulative count of Article Views (full-text article views including HTML views, PDF and ePub downloads, according to the available data) and Abstracts Views on Vision4Press platform.
Data correspond to usage on the plateform after 2015. The current usage metrics is available 48-96 hours after online publication and is updated daily on week days.
Initial download of the metrics may take a while.