Free Access
Fig. 6
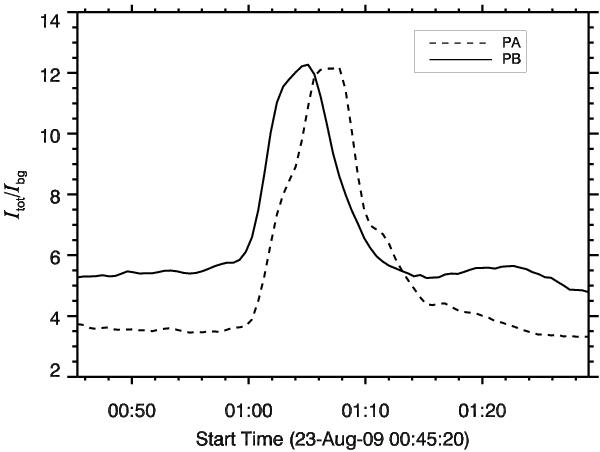
SXR light curves of patch A (PA, dashed line) and patch B (PB, solid line) during the strong-flash phase of the CBP. The intensity of PA is multiplied by 1.8 for better comparison with PB.
Current usage metrics show cumulative count of Article Views (full-text article views including HTML views, PDF and ePub downloads, according to the available data) and Abstracts Views on Vision4Press platform.
Data correspond to usage on the plateform after 2015. The current usage metrics is available 48-96 hours after online publication and is updated daily on week days.
Initial download of the metrics may take a while.