Fig. 5
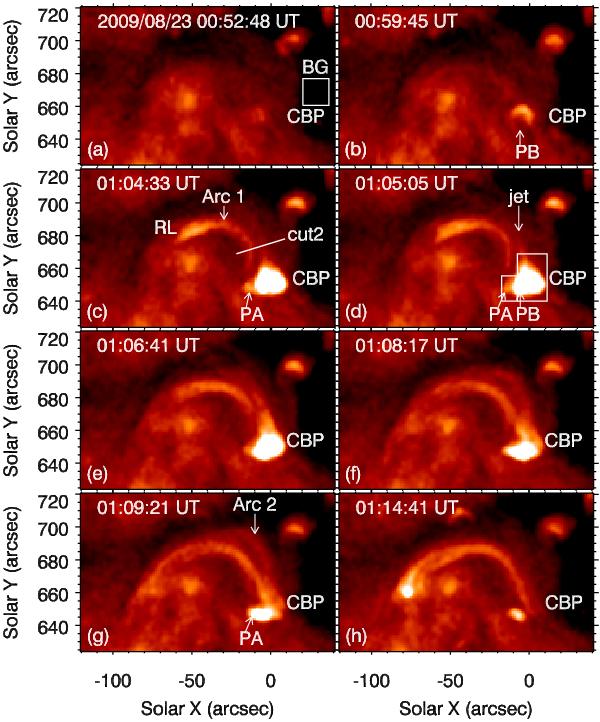
a)−h) Eight snapshots of the SXR images during the strong-flash phase of the CBP. PA, PB, “Arc 1”, and RL have the same meanings as in Fig. 2. “Arc 2” signifies the magnetic loop adjacent to “Arc 1”. The solid white line denoted with cut2 in panel c) is used for studying the transverse drift of “Arc 1”. An animation of this figure is available online.
Current usage metrics show cumulative count of Article Views (full-text article views including HTML views, PDF and ePub downloads, according to the available data) and Abstracts Views on Vision4Press platform.
Data correspond to usage on the plateform after 2015. The current usage metrics is available 48-96 hours after online publication and is updated daily on week days.
Initial download of the metrics may take a while.