Fig. 2
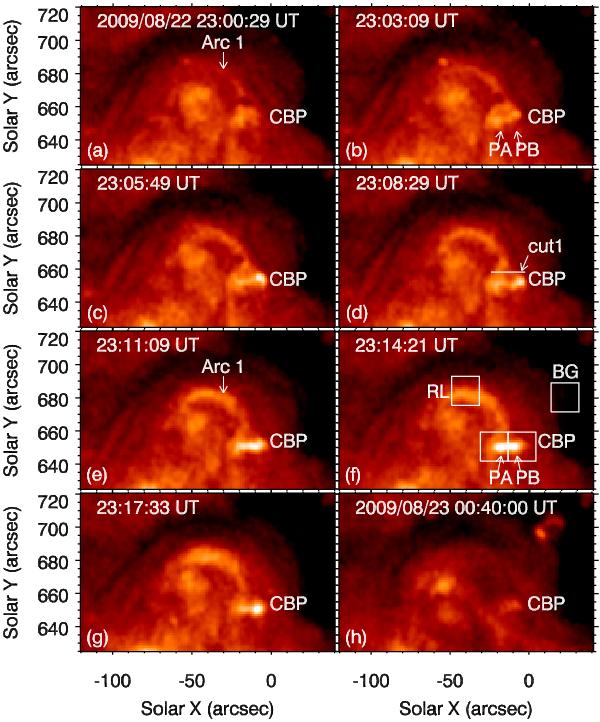
a)−h) Eight snapshots of the SXR images during the weak-flash phase of the CBP. PA and PB stand for patch A and patch B of the CBP. “Arc 1” signifies the magnetic loop connecting the CBP with the remote leg (RL). BG denotes the background region used for the calculation of light curves in Fig. 3. The solid white line denoted with cut1 in panel d) is used for studying the transverse drift of “Arc 1”. An animation of this figure is available online.
Current usage metrics show cumulative count of Article Views (full-text article views including HTML views, PDF and ePub downloads, according to the available data) and Abstracts Views on Vision4Press platform.
Data correspond to usage on the plateform after 2015. The current usage metrics is available 48-96 hours after online publication and is updated daily on week days.
Initial download of the metrics may take a while.