Fig. 1
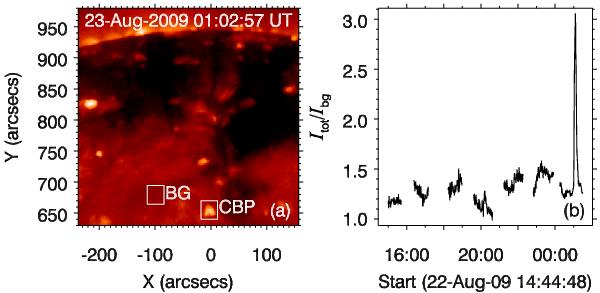
a) A partial-frame SXR image observed by XRT at 01:03 UT on August 23. The two white boxes stand for the background region (BG) and the CBP. b) SXR light curve of the CBP. The light curve is calculated to be the total flux of the CBP normalized by the total flux of BG. Note the data gap in panel b).
Current usage metrics show cumulative count of Article Views (full-text article views including HTML views, PDF and ePub downloads, according to the available data) and Abstracts Views on Vision4Press platform.
Data correspond to usage on the plateform after 2015. The current usage metrics is available 48-96 hours after online publication and is updated daily on week days.
Initial download of the metrics may take a while.