| Issue |
A&A
Volume 568, August 2014
|
|
|---|---|---|
| Article Number | C2 | |
| Number of page(s) | 1 | |
| Section | Stellar atmospheres | |
| DOI | https://doi.org/10.1051/0004-6361/201015307e | |
| Published online | 29 August 2014 | |
The rapid rotation and complex magnetic field geometry of Vega (Corrigendum)
1 Laboratoire d’Astrophysique de Toulouse-Tarbes, Université de Toulouse, CNRS, France
e-mail: This email address is being protected from spambots. You need JavaScript enabled to view it.
2 Department of Physics, Royal Military College of Canada, PO Box 17000, Station Forces, Kingston, Ontario, Canada
3 Armagh Observatory, College Hill, Armagh BT61 9DG, Northern Ireland, UK
4 Centre d’Étude Spatiale des Rayonnements, Université de Toulouse, CNRS, France
Key words: stars: magnetic field / stars: rotation / stars: atmospheres / stars: imaging / stars: individual: Vega / errata, addenda
New ZDI models have been recently computed for Vega, using the data sets presented by Petit et al. (2010). Stokes I pseudo-line profiles produced by the model were again compared to observed LSD pseudo-line profiles, and it was found that the model used by Petit et al. assumed a profile depth that was about 40% too large. All other parameters of the ZDI model were checked as well, and no other discrepancies were found. Several series of LSD profiles (computed from different line masks) were used by Petit et al. (2010), and the mismatch is most likely because the published ZDI model was calculated with a line depth optimized for a different set of LSD profiles with slightly different depths for normalization.
Reconstructing new maps of the magnetic field of Vega from the 2008 and 2009 datasets using the corrected line profile model (Fig. 1), we found that the photospheric field strength is about 40% greater than previously claimed, with a peak field strength of about 7 G. We emphasize that the modified line depth changes only the field strength, without affecting other aspects of the magnetic geometry at all, i.e. the reconstructed orientation of the local magnetic field vector. All other conclusions of the paper regarding the period search, the photospheric field distribution, and the absence of detectable magnetic variability of Vega remain unchanged.
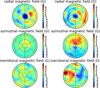 |
Fig. 1 Vectorial magnetic map of Vega for 2008 (left) and 2009 (right), in polar projection. The 3 rows illustrate the field projection onto one axis of the spherical coordinate frame with the radial, azimuthal, and meridional field components. The magnetic field strength is expressed in gauss. The phase origin is set at the bottom of each map and rotational phases are increasing in the clockwise direction. |
Acknowledgments
We thank Colin Folsom for bringing this mistake to our attention.
References
- Petit, P., Lignières, F., Wade, G. A., et al. 2010, A&A, 523, A41 [NASA ADS] [CrossRef] [EDP Sciences] [Google Scholar]
© ESO, 2014
All Figures
|
Fig. 1 Vectorial magnetic map of Vega for 2008 (left) and 2009 (right), in polar projection. The 3 rows illustrate the field projection onto one axis of the spherical coordinate frame with the radial, azimuthal, and meridional field components. The magnetic field strength is expressed in gauss. The phase origin is set at the bottom of each map and rotational phases are increasing in the clockwise direction. |
| In the text | |
Current usage metrics show cumulative count of Article Views (full-text article views including HTML views, PDF and ePub downloads, according to the available data) and Abstracts Views on Vision4Press platform.
Data correspond to usage on the plateform after 2015. The current usage metrics is available 48-96 hours after online publication and is updated daily on week days.
Initial download of the metrics may take a while.