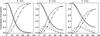
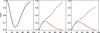
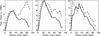
Fig. 4

First row: transmission and conversion coefficients for 3, 5 and 7 min waves (left, middle and right panels, respectively). The solid line represents T (Eq. (1)), while the dotted one T corrected for projection effects (T multiplied by cosθ). The dashed-dotted line represents the conversion coefficient, C = 1 − T and the dashed-dotted-dotted the one corrected for projection effects. In the middle and right panels, the dashed lines represent T′, which, in addition, takes into account the ramp effect (Eq. (3)). Second row: the dashed lines represent the sum of transmission and conversion, both corrected for projection and ramp effects. Red lines mark the acceptable curve for each period in quiet Sun (see text). Third row: photospheric (solid line) and chromospheric (dashed line) power versus the inclination at the canopy (attack angle) for 3, 5 and 7 min oscillations, calculated from observations.
Current usage metrics show cumulative count of Article Views (full-text article views including HTML views, PDF and ePub downloads, according to the available data) and Abstracts Views on Vision4Press platform.
Data correspond to usage on the plateform after 2015. The current usage metrics is available 48-96 hours after online publication and is updated daily on week days.
Initial download of the metrics may take a while.