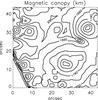
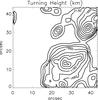
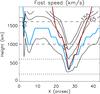
Fig. 2

Contours of the magnetic canopy height and the turning height over the entire FOV shown in Fig. 1 (left and middle panels, respectively). In the right panel the canopy and turning heights along the dashed line of Fig. 1 (blue and red lines, respectively) are plotted. These surfaces were smoothed over 1000 km for better visualization. Overplotted are contours of the fast speed up to a height of 2000 km. For reference, the estimated HOF (based on Leenaarts et al. 2006) of ± 0.70 Å and ± 0.35 ÅHα wings are also plotted (horizontal dotted and dashed lines, respectively).
Current usage metrics show cumulative count of Article Views (full-text article views including HTML views, PDF and ePub downloads, according to the available data) and Abstracts Views on Vision4Press platform.
Data correspond to usage on the plateform after 2015. The current usage metrics is available 48-96 hours after online publication and is updated daily on week days.
Initial download of the metrics may take a while.