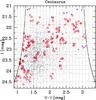
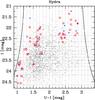
Fig. 4

Colour–magnitude diagram in U − I of all unresolved sources detected in both galaxy clusters. The black curved lines represent the colour cut-off applied to disregard sources either too blue or too red to be considered old GCs. The horizontal lines define rows of 200 GCs, and the vertical lines define columns of 0.1 mag. Within the cells defined by the horizontal and vertical lines, a random background subtraction is performed: the blue circles indicate colours and magnitudes of the background sources. Red circles indicate sources that were removed based on the background source distribution, within the indicated cells. We note that the very brighest magnitude regions I< 21 mag are excluded from the plot to focus on the main body of GCs.
Current usage metrics show cumulative count of Article Views (full-text article views including HTML views, PDF and ePub downloads, according to the available data) and Abstracts Views on Vision4Press platform.
Data correspond to usage on the plateform after 2015. The current usage metrics is available 48-96 hours after online publication and is updated daily on week days.
Initial download of the metrics may take a while.