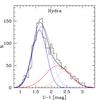
Fig. 3
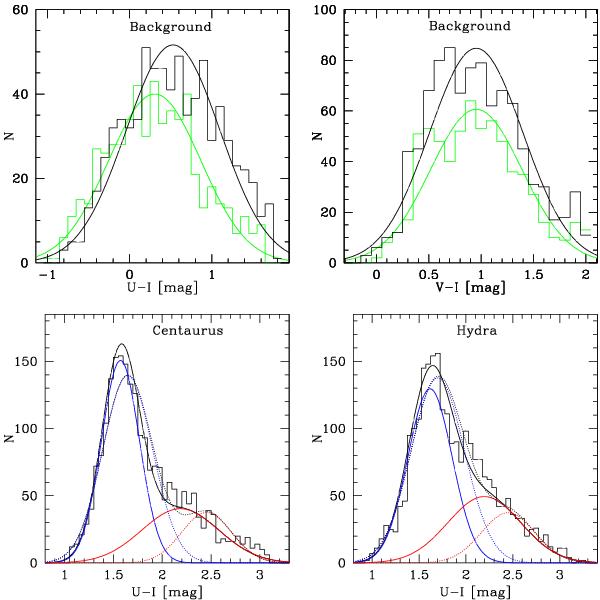
Top: colour distribution of the background fields: Centaurus is in black and Hydra in green. Left panel: U − I. Right panel: V − I. The lines correspond to single Gaussian peaks fitted with KMM. Because of the shift in U − I between both clusters, symmetric shifts of ±0.11 mag are applied to the U-band zeropoints for Hydra and Centaurus, see text for details. Bottom: finally adopted U − I colour distribution of the full Hydra (left) and Centaurus (right) cluster GC samples (restricted to the later used fitting range I< 24 mag). The coloured lines represent the Gaussian fits by KMM to the blue and red peak. The black lines are the sum of the two. The dotted lines represent the results using the homoscedastic mode; the solid lines correspond to the heteroscedactic mode.
Current usage metrics show cumulative count of Article Views (full-text article views including HTML views, PDF and ePub downloads, according to the available data) and Abstracts Views on Vision4Press platform.
Data correspond to usage on the plateform after 2015. The current usage metrics is available 48-96 hours after online publication and is updated daily on week days.
Initial download of the metrics may take a while.