Fig. 8
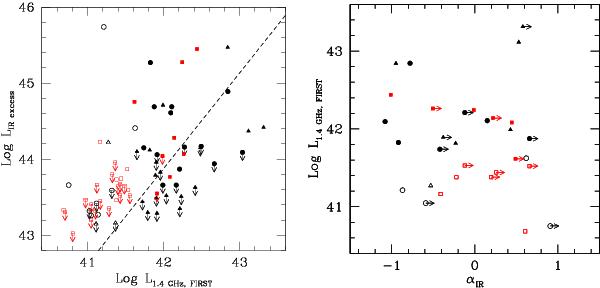
Infrared excess luminosity (erg s-1) versus (left panel) rest-frame FIRST radio luminosity (erg s-1) and (right panel) spectral index from 8 to 24 μm estimated from the IR excess in the SED above the stellar emission (right panel). Black empty points are LPs, while filled black points are HPs. The FR IIs are the black triangles. The red squared points represent the sample studied by B13: LPs are the empty points and HPs the filled ones. The radio-IR correlation is the dashed line, and its parameters are shown in Table 6.
Current usage metrics show cumulative count of Article Views (full-text article views including HTML views, PDF and ePub downloads, according to the available data) and Abstracts Views on Vision4Press platform.
Data correspond to usage on the plateform after 2015. The current usage metrics is available 48-96 hours after online publication and is updated daily on week days.
Initial download of the metrics may take a while.