Fig. 6
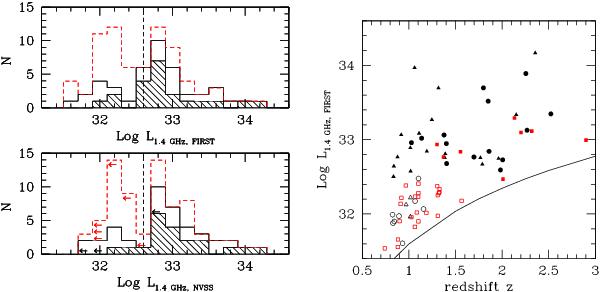
Left panel: distribution of the rest-frame total radio luminosity (in erg s-1 Hz-1) at 1.4 GHz from the FIRST data (upper panel) and NVSS data (lower panel). The dashed lines correspond to the local FR I/FR II break used to separate the sample in HP and LP sources. The FR IIs distribution is represented by the back-slash shaded histogram. The dashed histogram represents the entire COSMOS RL AGN sample at high redshifts. Right panel: redshifts versus the rest-frame FIRST radio luminosity at 1.4 GHz (in erg s-1 Hz-1). The empty points are the LPs, and the full points are the HPs. The FR IIs are the triangles. The red squared points represent the sample studied by B13: LPs are the empty points and HPs the filled ones. The solid line represents the luminosity-redshift relation corresponding to the flux limit of the FIRST survey (between 1−0.6 mJy but we use 0.75 mJy for the plot.)
Current usage metrics show cumulative count of Article Views (full-text article views including HTML views, PDF and ePub downloads, according to the available data) and Abstracts Views on Vision4Press platform.
Data correspond to usage on the plateform after 2015. The current usage metrics is available 48-96 hours after online publication and is updated daily on week days.
Initial download of the metrics may take a while.