Fig. A.4
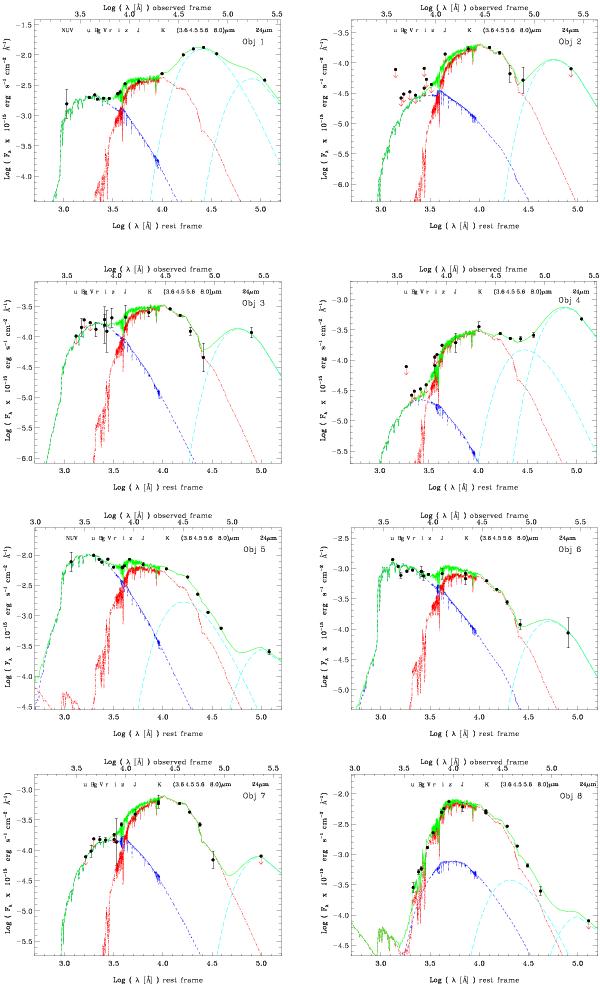
SEDs of the objects of the sample. The model is the green line, which includes the YSP (blue), the OSP (red), and the dust component(s) (cyan). The wavelengths on top of the plots correspond to observed wavelengths, while those on bottom are at rest frame. For the two spectroscopically confirmed quasars (objects 29 and 37) we only show the photometric points.
Current usage metrics show cumulative count of Article Views (full-text article views including HTML views, PDF and ePub downloads, according to the available data) and Abstracts Views on Vision4Press platform.
Data correspond to usage on the plateform after 2015. The current usage metrics is available 48-96 hours after online publication and is updated daily on week days.
Initial download of the metrics may take a while.