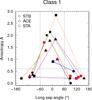
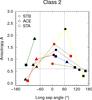
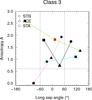
Fig. 9
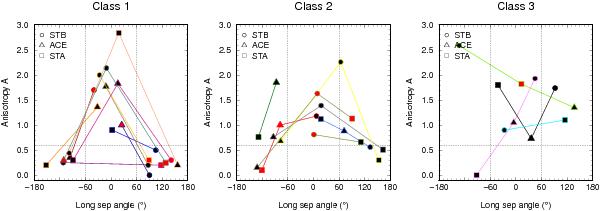
Maxima of absolute anisotropies observed during the early phases of the events. The observations have been ordered into three different classes (see text) that appear in the left, middle, and right panels. Red symbol fillings denote that the anisotropy may be underestimated because of poor pitch-angle coverage, black fillings mean that the pitch-angle coverage was sufficient. The dashed lines mark the borders that define the different anisotropy classes (see text).
Current usage metrics show cumulative count of Article Views (full-text article views including HTML views, PDF and ePub downloads, according to the available data) and Abstracts Views on Vision4Press platform.
Data correspond to usage on the plateform after 2015. The current usage metrics is available 48-96 hours after online publication and is updated daily on week days.
Initial download of the metrics may take a while.