Fig. 3
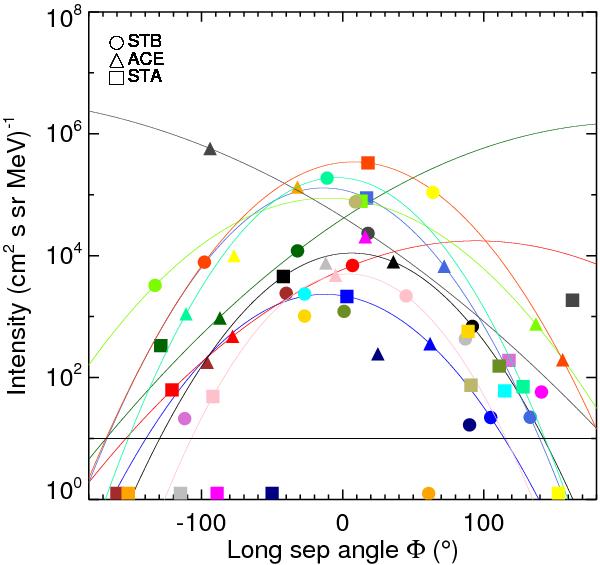
Peak intensities as a function of longitudinal separation angle. Positive separation angles denote a source to the west, negative angles mark a source to the east of the spacecraft magnetic footpoint. Observations of the same event are marked by the same color. Points lying on the horizontal axis denote that there were no observations because of various reasons (cf. Tables 2 and 3). The curves represent Gaussian fits (Eq. (1)) for the three-spacecraft events.
Current usage metrics show cumulative count of Article Views (full-text article views including HTML views, PDF and ePub downloads, according to the available data) and Abstracts Views on Vision4Press platform.
Data correspond to usage on the plateform after 2015. The current usage metrics is available 48-96 hours after online publication and is updated daily on week days.
Initial download of the metrics may take a while.