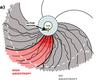
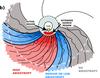
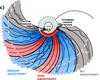
Fig. 11

Regions of varying anisotropy for different source and transport processes. Each diagram describes a wide-spread event extending over all the colored range. While scenario a) represents a small source region at the Sun (yellow star), an additional extended source region is present in scenarios b) and c), represented by the red arc. Reddish areas mark regions where strong anisotropy is observed, blue regions mark medium anisotropy, and gray areas are regions where no anisotropy can be measured any more. Wavy magnetic field lines represent regions with perpendicular transport in the IP medium.
Current usage metrics show cumulative count of Article Views (full-text article views including HTML views, PDF and ePub downloads, according to the available data) and Abstracts Views on Vision4Press platform.
Data correspond to usage on the plateform after 2015. The current usage metrics is available 48-96 hours after online publication and is updated daily on week days.
Initial download of the metrics may take a while.