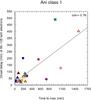
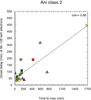
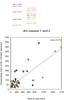
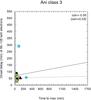
Fig. 10

Onset delay (type III to electron onset) as a function of the rise time of the events. Panel a) shows only measurements of class (1), b) of class (2), and d) of class (3). Panel c) combines class (1) and class (2) events. The Pearson correlation coefficient of each group is presented at the top right of each panel, the solid line represents the corresponding fit. The value in brackets of panel b) describes the correlation if the yellow point to the right is excluded, the value in brackets in panel d) is the correlation when excluding the top cyan point. The dashed line corresponds to these correlations.
Current usage metrics show cumulative count of Article Views (full-text article views including HTML views, PDF and ePub downloads, according to the available data) and Abstracts Views on Vision4Press platform.
Data correspond to usage on the plateform after 2015. The current usage metrics is available 48-96 hours after online publication and is updated daily on week days.
Initial download of the metrics may take a while.