Fig. 15
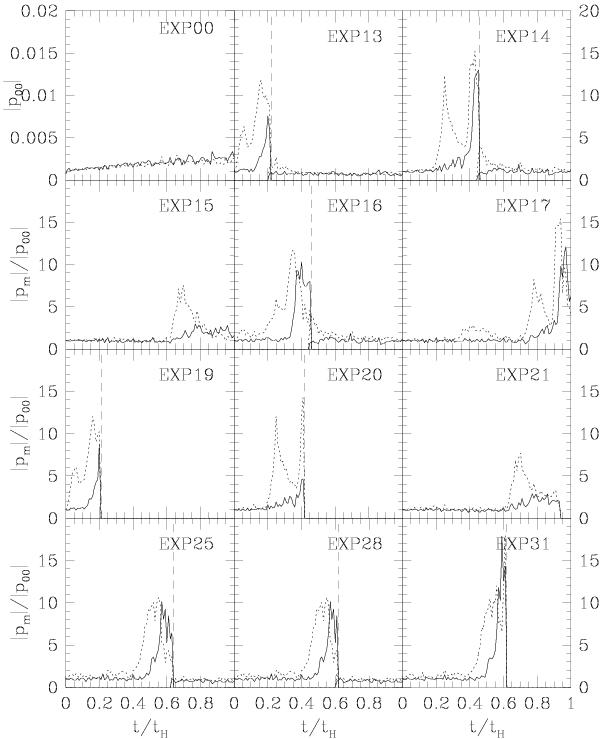
Global integrated ratio amplitudes of the modes m = 1 (solid lines) and m = 2 (dotted lines) for the primary galaxy (G1) for the simulations 15 and 17 during a Hubble time. The | p00 | denotes the global amplitude of the control simulation EXP00. For simulations EXP13, 16, 25, and 28 we show the global ratio amplitudes for G1 until the merger time, denoted by the dashed lines. After the merge we show the global ratio amplitude of the compound galaxy (G1 + G2). For experiments EXP19, 20, and 31 (polar disk), we plot the evolution of G1 until the merger of G1 and G2, represented again by the dashed lines.
Current usage metrics show cumulative count of Article Views (full-text article views including HTML views, PDF and ePub downloads, according to the available data) and Abstracts Views on Vision4Press platform.
Data correspond to usage on the plateform after 2015. The current usage metrics is available 48-96 hours after online publication and is updated daily on week days.
Initial download of the metrics may take a while.