Fig. 1
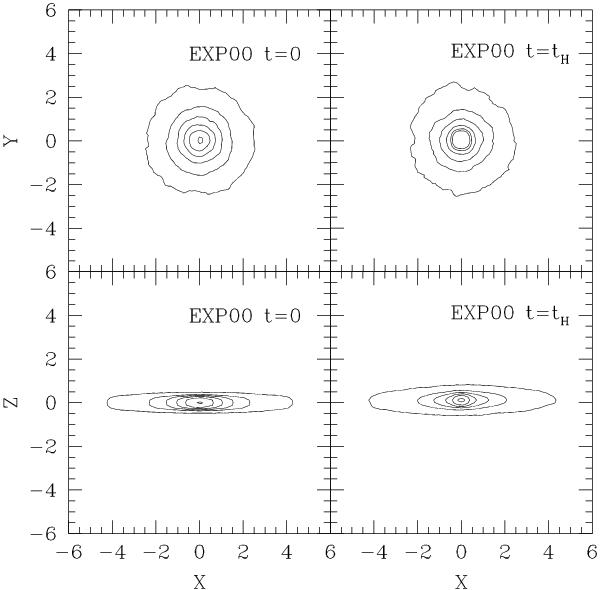
Contour plot of the primary galaxy at the beginning of the simulation (t = 0) and at the Hubble time of the simulation (t = tH). The smoothing was made by averaging the 25 first and second neighbors of each pixel. Hereafter, the density levels in the planes XY and XZ at t = 0 will be used in all the contour plots, in the planes XY and XZ, respectively.
Current usage metrics show cumulative count of Article Views (full-text article views including HTML views, PDF and ePub downloads, according to the available data) and Abstracts Views on Vision4Press platform.
Data correspond to usage on the plateform after 2015. The current usage metrics is available 48-96 hours after online publication and is updated daily on week days.
Initial download of the metrics may take a while.