| Issue |
A&A
Volume 567, July 2014
|
|
|---|---|---|
| Article Number | A6 | |
| Number of page(s) | 8 | |
| Section | Stellar structure and evolution | |
| DOI | https://doi.org/10.1051/0004-6361/201423615 | |
| Published online | 04 July 2014 | |
2MASS J154043.42−510135.7: a new addition to the 5 pc population⋆
1
Dpto. Física Aplicada, Universidad Politécnica de Cartagena,
Campus Muralla del Mar, Cartagena,
30202
Murcia,
Spain
e-mail:
This email address is being protected from spambots. You need JavaScript enabled to view it.
2
Instituto de Astrofísica de Canarias (IAC),
Calle Vía Láctea s/n, 38200 , La
Laguna, Tenerife,
Spain
3
Departamento de Astrofísica, Universidad de La Laguna
(ULL), 38205 , La
Laguna, Tenerife,
Spain
4
Departamento de Astronomía, Universidad de Chile,
Casilla 36-D, Santiago, Chile
5
Consejo Superior de Investigaciones Científicas,
CSIC,
Spain
6
Centro de Astrobiología (CSIC-INTA), Ctra. Ajalvir km 4, 28850
Torrejón de Ardoz, Madrid, Spain
Received: 11 February 2014
Accepted: 15 May 2014
Abstract
Aims. The aim of the project is to find the stars closest to the Sun and to contribute to the completion of the stellar and substellar census of the solar neighbourhood.
Methods. We identified a new late-M dwarf within 5 pc, looking for high proper motion sources in the 2MASS–WISE cross-match. We collected astrometric and photometric data available from public large-scale surveys. We complemented this information with low-resolution (R ~ 500) optical (600–1000 nm) and near-infrared (900–2500 nm) spectroscopy with instrumentation on the European Southern Observatory New Technology Telescope to confirm the nature of our candidate. We also present a high-quality medium-resolution VLT/X-shooter spectrum covering the 400 to 2500 nm wavelength range.
Results. We classify this new neighbour as an M7.0 ± 0.5 dwarf using spectral templates from the Sloan Digital Sky Survey and spectral indices. Lithium absorption at 670.8 nm is not detected in the X-shooter spectrum, indicating that the M7 dwarf is older than 600 Myr and more massive than 0.06 M⊙. We also derive a trigonometric distance of 4.4+0.5-0.4 pc, in agreement with the spectroscopic distance estimate, making 2MASS J154043.42−510135.7 (2M1540) the nearest M7 dwarf to the Sun. This trigonometric distance is somewhat closer than the ~6 pc distance reported by the ALLWISE team, who independently identified this object recently. This discovery represents an increase by 25% in the number of M7–M8 dwarfs already known at distances closer than 8 pc from our Sun. We derive a density of ρ = 1.9 ± 0.9 × 10⁻³ pc-3 for M7 dwarfs in the 8 pc volume, a value similar to those quoted in the literature.
Conclusions. This new ultracool dwarf is among the 50 closest systems to the Sun, demonstrating that our current knowledge of the stellar census within the 5 pc sample remains incomplete. 2M1540 represents a unique opportunity to search for extrasolar planets around ultracool dwarfs due to its proximity and brightness.
Key words: stars: low-mass / techniques: photometric / techniques: spectroscopic / surveys
Based on observations collected at the European Organisation for Astronomical Research in the Southern Hemisphere, Chile.
© ESO, 2014
1. Introduction
The quest for the nearest and coolest neighbours has always been a holy grail because these objects offer rare opportunities to study stellar properties in great detail (e.g. atmospheric composition, age, mass, binarity, etc.) and they represent unique targets for extrasolar planet searches. The brightest stars such as Sirius, Alpha Centauri and Procyon have been recorded in 195 BC, 650 BC, and 275 BC, respectively. Moreover, most of the systems within 5 pc of the Sun have been discovered over several centuries. Only a few additions to the list of nearest systems have been announced. Since 2000, sixteen new objects have been added to the list of nearest systems. The Wide-field Infrared Survey Explorer (WISE; Wright et al. 2010) has contributed to some of these discoveries, particularly to those with LTY spectral types (Kirkpatrick et al. 2011, 2012; Cushing et al. 2011; Marsh et al. 2013; Dupuy & Kraus 2013; Bihain et al. 2013; Luhman 2013; Mamajek 2013; Marsh et al. 2013). The other discoveries within 5 pc from the Sun that do not originate from WISE are the Epsilon Indi Ba/Bb binary at 3.626 pc made of a T1+T6 (Scholz et al. 2003; McCaughrean et al. 2004; King et al. 2010), the T6 substellar companion to SCR 1845−6357 (Biller et al. 2006; Kasper et al. 2007) at 3.84 pc (Deacon et al. 2005), the T9 dwarf UGPS 0722−05 at 4.12 pc (Lucas et al. 2010; Leggett et al. 2012), the T6 dwarf DENIS J081730.0−615520 at 4.93 pc (Artigau et al. 2010). Two stellar additions to the 5 pc census are SCR 1845−6357 (M8.5; Henry et al. 2006) and Teegarden’s star at 3.84 pc (M6.5; Teegarden et al. 2003).
With the advent of large-scale surveys, in particular of the Sloan Sky Digital Survey (SDSS; York et al. 2000), the properties of large samples of M dwarfs were characterized (Hawley et al. 2002; West et al. 2004; Schmidt et al. 2010). Bochanski et al. (2010) reported new measurements of the luminosity and mass functions of field low-mass dwarfs derived from SDSS data release 6 (DR6) over an area of 8400 square degrees. West et al. (2011) presented a spectroscopic catalogue of 70 841 M dwarfs from the SDSS DR7, including the identification of eight new late-type M dwarfs possibly within 25 pc. However, the density of the latest M dwarfs still suffers from many uncertainties, with the first estimate of their density from Kirkpatrick & McCarthy (1994), see also the compilation by Caballero et al. (2008). More recent studies, conducted in the solar neighbourhood by Cruz et al. (2007), yielded a density of 1.9–2.2×10⁻³ pc-3 for M7–M8 dwarfs.
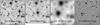 |
Fig. 1 Images of the new M dwarf: from left to right are shown the optical images from the Digital Sky Survey (DSS IR; 10 April 1982), the near-infrared J-band from 2MASS (5 July 1999), and the mid-infrared 4.5 micron image from WISE (24 February 2010), and our NTT EFOSC2 image (4 October 2013) to illustrate the motion and colours of 2M1540. Each image is ~2 arcmin aside with north up and east to the left. |
The main objective of our investigation is to uncover overlooked stars and brown dwarfs in the solar neighbourhood by searching for high proper motion sources by cross-correlating public databases. In this paper, we report on a fast-moving late-type M dwarf, 2MASS J154043.42−510135.7 (hereafter 2M1540), identified in a cross-correlation between the Two Micron All-Sky Survey (2MASS; Cutri et al. 2003; Skrutskie et al. 2006) and WISE (Wright et al. 2010) public all-sky surveys. In the process of writing this paper, we learned of the independent discovery of this object by Kirkpatrick et al. (2014), who reported it as an M6 dwarf located at ~6 pc. Here we present new astrometry, photometry, and optical and near-infrared spectroscopy, providing a slightly different trigonometric distance and spectral type determination. 2M1540 is among the 50 closest systems, the third late-M discovered during the past decade, and the closest M7 dwarf to the Sun. In Sect. 2 we describe our selection procedure that led to the identification of this nearby M dwarf. In Sect. 3 we present our optical and near-infrared spectroscopic follow-up and assign a spectral type to 2M1540. In Sect. 4 we estimate the parallax of 2M1540 using all epochs available in public databases and derive a spectroscopic distance. In Sect. 6 we place our work in context and present some future work to look for extrasolar planets.
2. Selection method
We cross-correlated the 2MASS Point Source Catalogue (Cutri et al. 2003) with the All Sky WISE Catalogue (Wright et al. 2010) with the aim of finding red/brown dwarfs in the solar neighbourhood. In particular, we focused on objects brighter than J = 12 mag. In our search, we looked for pairs of uncorrelated objects in 2MASS and WISE that are separated by distances larger than two arcsec and less than 60 arcsec between both catalogues. We considered “uncorrelated” objects those that are in one catalogue with no counterpart in the other database within our minimum radius of two arcsec. These pairs represent high proper motion candidates with motions in the range ~0.15–4.6 arcsec/yr, given the temporal baseline between both surveys (~11–14 yr). A given pair was discarded from our list of candidates if there existed a counterpart in the USNO-B1 catalogue (Monet et al. 2003). Furthermore, we excluded from our list point sources with 2MASS J − Ks colours between 0.4 and 0.8 mag, negative WISE colours (w1 − w2 ≤ 0 mag), and less than four WISE detections ( w1nm and w2nm criteria less than 4) to focus our search on low-mass stars and/or brown dwarfs. Additional contaminants were removed by visual inspection of the multi-epoch images (Fig. 1). In our final list, we identified a number of already known nearby M and L dwarfs, e.g. WISE J104915.57−531906.1 at 2 pc (or Luhman16AB; Luhman 2013; Mamajek 2013) and the late-M dwarf 2M1540, which is the subject of this paper.
3. Spectroscopic follow-up
3.1. Optical photometry and spectroscopy
We obtained imaging and spectroscopy of 2M1540 with the ESO Faint Object Spectrograph and Camera (EFOSC2) installed on the 3.58 m New Technology Telescope (NTT) in La Silla (Chile) during two consecutive nights in visitor mode on 4 and 5 October 2013. Both nights were dark, photometric with clear skies and sub-arcsec seeing. EFOSC2 is equipped with a Loral/Lesser, thinned, ultraviolet flooded 2048×2048 chip sensitive to optical wavelengths. The 2×2 binning mode offers a pixel scale of 0.24 arcsec and a field-of-view of 4.1×4.1 arcmin.
We collected short exposures in the Sloan i filter to improve our astrometric measurements (right-hand side finding-chart in Fig. 1). We employed an on-source integration of 1.5 s in this filter. On the other hand, we obtained low-resolution (R ~ 500) optical spectroscopy with the grating number 16 set at parallactic angle to confirm the nature of our candidate. We used a 2 s exposure in the Gunn i filter (#705) centred on 669.4 nm to place our target in the slit and grism #16 with a slit of 1 arcsec for spectroscopic observations, covering the 600–1000 nm wavelength range. We obtained two single exposures of 300 s and 180 s on 11 and 12 October 2013, respectively, to check for spectral variability. We observed an internal flat field immediately after the spectrum of the target to correct for fringing, which affects grism #16 beyond ~720 nm. We obtained bias and arc frames during the afternoon preceding our observations as well as a spectro-photometric standard star (LTT7379; Hamuy et al. 1992) during the night to apply the instrumental response to our target.
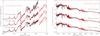 |
Fig. 2 Low-resolution (R ~ 500) optical (600–1000 nm) and near-infrared (900–2500 nm) spectra of 2M1540 (red lines) obtained with EFOSC2 (left) and SofI (right) on the NTT, respectively. We normalised the optical and near-infrared spectra at 750 and 1650 nm, respectively. Plotted in black below the optical spectrum of 2M1540 are three spectral template corrected for telluric absorptions (red line) from the SDSS spectroscopic database with spectral types bracketing our target (M6.5, M7, and M7.5; Bochanski et al. 2007). Plotted in black below the near-infrared spectrum of 2M1540 are spectral templates from the IRTF spectral library: Gl 406 (M6), GJ 1111 (M6.5; Kirkpatrick et al. 1991, 2012; Jenkins et al. 2009a), and Gl 644C (Zakhozhaj 1979; Boeshaar & Tyson 1985; Kirkpatrick et al. 2012). |
We carried out the spectroscopic data reduction of 2M1540 under the IRAF environment (Tody 1986, 1993). We used the imaging data only for astrometric purposes. For the spectroscopy, we subtracted a median-combined bias frame and divided by a normalised internal flat field to remove fringing in the red part of the spectrum. We extracted a one-dimensional (1D) spectrum, using optimal aperture extraction and the APALL routine. We calibrated our spectrum in wavelength with helium-argon arc lamps before applying the instrumental response, using the LTT7379 spectro-photometric standard star observed each night. The final 1D optical spectrum of 2M1540, normalised at 750 nm, is displayed on the left-hand side panel of Fig. 2.
Furthermore, we conducted photometric observations in the V, R, SDSSr, SDSSi, and SDSSz filters with EFOSC2 on 13 March 2014. We reduced the data using the ESO GASGANO pipeline on the mountain, which includes bias substraction and flat-field correction. Weather conditions were photometric and seeing varied between 0.4 and 1.3 arcsec. We carried out aperture photometry with DAOPHOT within ithe IRAF environment. We converted the instrumental magnitudes into apparent magnitudes in the Cousin (Vega magnitudes) and Sloan (AB magnitudes) systems using photometric standards from Landolt (1992) and Smith et al. (2002), respectively (see Table 1). The comparison of optical and near-infrared colours of 2M1540 with the colours of field M dwarfs published by Kirkpatrick & McCarthy (1994) and West et al. (2011) suggests an estimated spectral type of M6–M7, in agreement with our spectroscopic type determination of M7 (Sect. 3.4).
Coordinates, optical, and infrared photometry from public databases and our own measurements, along with our parallax and proper motion measurements and physical properties derived for 2M1540.
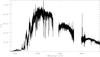 |
Fig. 3 VLT/X-shooter spectrum of 2M1540 covering the UVB, VIS, and NIR wavelength range, from 400 to 2500 nm at a resolution of 4000−6800. The spectrum has been corrected for telluric absorption. |
3.2. Near-infrared spectroscopy
We collected a low-resolution (R ~ 600) near-infrared spectrum of 2M1540 with the blue (950–1640 nm) and red (1530–2520 nm) grisms combined with a slit of 1 arcsec with the Son of ISAAC (SofI) spectro-imager installed on the NTT on 20 October 2013. SofI is equipped with a Hawaii HgCdTe 1024×1024 array with squared 18.5 micron pixels. We used the large-field mode, offering a field-of-view of 4.9×4.9 arcmin with a 0.288 arcsec pixel scale. We set the on-source integrations to five seconds, repeated five times with an ABBA pattern for both configurations to remove the sky contribution. We observed a hot star with the same configuration(HIP74940; V = 8.58 mag; A0V; Houk 1978; van Leeuwen 2007; Høg et al. 2000) immediately before 2M1540 with an AB pattern in each configuration and at a similar airmass to correct for telluric features. The conditions were photometric at the time of the observations with sub-arcsec seeing. We observed Xenon arc lamps during the afternoon to calibrate our spectra in wavelength.
We used the ESO SofI pipeline (gasgano) on the mountain to obtain a combined dispersed image from the four ABBA positions along the slit. We extracted a 1D spectrum with standard spectroscopic routines under IRAF (Tody 1986, 1993) and calibrated it in wavelengths with Xenon lamps with an rms better than 0.4 Å and 0.7 Å in the blue and red part of the spectrum, respectively. Then, we divided this spectrum by the 1D spectrum of the telluric standard (also reduced with the pipeline and extracted with IRAF), which we later multiplied by the appropriate spectral template of an A0V star smoothed to our resolution1. The final near-infrared spectrum of 2M1540, normalised at 1650 nm, is displayed on the right-hand side of Fig. 2.
3.3. X-shooter spectrum
We obtained a VLT/X-shooter spectrum of 2M1540 covering the ultraviolet, visible, and near-infrared regions, from 350 to 2500 nm, at resolutions between 4000 and 7000 on 10 March 2014 in visitor mode (ESO programme number 092.C-0229). The sky was clear at the time of the observations with sub-arcsec seeing. We used four exposures of 120 s in each arm, yielding a clear detection at wavelengths longwards of 400 nm due to the brightness of the object. Calibrations were taken during the afternoon preceding the observations, in accordance with the instrument calibration plan, including bias, dark, flat field, and arc frames. Telluric (Hip 73881; B2–B3; Houk 1978; van Leeuwen 2007) and flux (EG 274; DA2; Oswalt et al. 1988; Hamuy et al. 1992; Holberg et al. 2002; van Leeuwen 2007) standards were observed very close in time to the target.
X-shooter (Vernet et al. 2011) is a multi-wavelength cross-dispersed echelle spectrograph made of three independent arms that simultaneously covers the ultraviolet (UVB; 300–560 nm), visible (VIS; 560–1020 nm), and near-infrared (NIR; 1020–2480 nm) wavelength ranges thanks to two dichroics that split the light. The spectrograph is equipped with three detectors: a 4096×2048 E2V CCD44-82, a 4096×2048 MIT/LL CCID 20, and a 2096×2096 Hawaii 2RG for the UVB, VIS, and NIR arms, respectively. We used the 1.2 arcsec slit (1.3 arcsec for the UVB arm) to achieve a nominal resolution of 4000 (8.1 pixel per full width at half maximum) in the UVB, 6700 in the VIS arm (7.9 pixel per FWHM, and 3890 in the NIR arm (5.8 pixel per full-width-half-maximum) in the VIS arm.
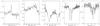 |
Fig. 4 Zoom on some specific regions of the VLT/X-shooter spectrum of 2M1540: from left to right, Hα at 656.3 nm, lithium at 670.8 nm, potassium around 770 nm, and sodium at ~819 nm and ~2200 nm. |
We reduced the X-shooter spectra on each arm independently using the command lines part of the esorex package (version 2.2.0) provided by ESO. We followed the steps enumerated in the manual to construct a final 2D spectrum and the associated 1D spectrum for 2M1540 and the standard star in each arm. First, we created a master bias and master dark. Afterwards, we determined a first-guess order, and then we refined the line tables by illuminating the X-shooter pinhole with a continuum lamp. Later, we created a master flat and an order table tracing the flat edges before establishing the 2D map of the instrument. Subsequently, we determined the efficiency of the whole system made of the telescope, instrument, and detector. Finally, we generated the 2D spectrum in nodding mode for 2M1540 and its standard star. We also corrected the VIS and NIR parts of the X-shooter spectrum for telluric absorption using the normalised continuum of the telluric standard Hip 73881. In Fig. 3, we plot the 1D flux-calibrated and telluric-corrected spectrum of 2M1540 covering the 350–2500 nm range. This spectrum is of high quality and will serve as template for future works because 2M1540 is currently the closest M7 dwarf to the Sun. In Fig. 4 we display some specific regions around absorption/emission lines and doublets of interest.
3.4. Spectral classification
We attempted to classify 2M1540 using the optical and infrared spectra independently. The two optical spectra of 2M1540 taken on two consecutive nights are similar. For the optical, we compared our EFOSC spectrum to the set of M dwarf templates from the SDSS spectroscopic database (York et al. 2000). Bochanski et al. (2007) made publicly available a repository of good-quality spectra (corrected for telluric absorption) for M0–M9 dwarfs spanning the 380–940 nm wavelength range at a resolution of 18002. The spectral types are derived from spectral indices defined in Reid et al. (1995) and Hawley et al. (2002). We created additional templates for the M0.5 to M8.5 subtypes by averaging the optical spectra of the bracketing classes to fine-tune our spectral classification. On the left-hand side panel of Fig. 2 we overplot our spectrum of 2M1540 (red line) on top of three Sloan spectral templates with spectral types of M6.5, M7.0, and M7.5. The best fit is obtained for the M7 dwarf. Hence, we optically classify our new discovery as an M7 dwarf, with an uncertainty of 0.5 subtype. This classification is one subtype later than the spectral type reported by Kirkpatrick et al. (2014). We arrive at the same conclusion from the analysis of the X-shooter spectrum, comparing with the spectrum of the nearby M6 dwarf Gl 644C (Monet et al. 1992; Kirkpatrick et al. 2012) kindly provided by the team that builds the X-shooter spectral library (Chen et al. 2014).
Moreover, we computed spectral indices for the two spectra obtained on 4 and 5 October. We measured a PC3 index of 1.40–1.42, leading to spectral types of M6.2–M6.3±0.4 (Martín et al. 1999). We measured TiO5 and VO-a indices of 0.26–0.35 and 2.13–2.14 (Reid et al. 1995; Kirkpatrick et al. 1999), yielding spectral types of M7.5–M8.2±0.4 and M6.1–M6.2±0.8, respectively. However, we emphasise that these indices are not suitable for M6–M8 dwarfs due to the degeneracy around these spectral types, as discussed by Cruz & Reid (2002). Overall, the average value of those three spectral indices suggests a spectral type of M6.6±0.9, consistent with our classification based on SDSS spectral templates.
We compared our SofI spectrum with several late-M dwarf templates from the NASA Infrared Telescope Facility (IRTF) Medium-Resolution Spectrograph and Imager (SpeX; Rayner et al. 2003; Cushing et al. 2004) library3 (Cushing et al. 2005; Rayner et al. 2009). We plot three well-known M dwarfs (black spectra) below our SofI spectrum (red line) in Fig. 2: Gl 406 (M6), GJ 1111 (M6.5; Kirkpatrick et al. 1991, 2012; Jenkins et al. 2009a), and Gl 644C (M7; Zakhozhaj 1979; Boeshaar & Tyson 1985; Kirkpatrick et al. 2012). The M6.5 spectral template type seems to best reproduce the overall spectral energy distribution and the molecular absorption bands of 2M1540 in the 1100–2500 nm range, in agreement with our optical classification. Based on the optical and near-infrared spectra, we finally adopt for our object a spectral type of M7.0±0.5 (Table 1).
We did not detect lithium in absorption and set an upper limit of 0.2 Å on its pseudo-equivalent width (Fig. 4). We did not detect Hα in emission nor lithium in absorption in the low-resolution optical spectrum of 2M1540. However, we did see an emission line at 656.3 nm in the X-shooter spectrum, with a pseudo-equivalent width of 1.0±0.2 Å. (Fig. 4. The lack of detection in the Galaxy Evolution Explorer (GALEX; Martin & GALEX Team 2005), the Extreme Ultraviolet Explorer (EUVE; Boyd et al. 1994), and the Röntgen satellite (ROSAT; Truemper 1993) catalogues corroborates the low level of activity in this M7 dwarf.
Pseudo-equivalent widths (pEW) of lines and doublets measured in the VLT/X-shooter spectrum of 2M1540.
We measured the pseudo-equivalent widths of the potassium and sodium doublets present in the optical and near-infrared regions of the X-shooter spectrum with the SPLOT routine in IRAF. We defined the pseudo-continuum immediately before and after the atomic absorption features at the spectral resolution of the data. We resolved the two doublets at 766.5/769.9 nm 818.3/819.8 nm, respectively. We measured pseudo-equivalent widths of 7±1 Å/4±1 Å and 2.8±0.6 Å/3.4±0.2 Å, respectively (Table 2). In the near-infrared, we measured pseudo-equivalent widths of 2.8±0.2/3.4±0.3 Å, 2.5±0.4/4.0±0.4 Å, and 1.7±0.3/2.2±0.4 Å for the (resolved) sodium doublet at 1138/1140 nm and the potassium doublets at 1169/1177 and 1244/1253 nm, respectively (Table 2). All these measurements are typical for old nearby late-M (M6.5–M8) dwarfs, as measured on the IRTF spectral templates.
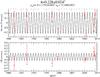 |
Fig. 5 Parallactic motion for 2M1540. Proper motion produced by the fitting has been removed for clarity. |
4. Distance estimates for 2M1540
4.1. Trigonometric parallax
We fitted for the parallax and proper motion of 2M1540 using the data in Table 3. For the DSS-1, POSS-2, and NTT images (Fig. 1), we measured the centroids of all stars in each image using the task daofind under the IRAF environment (Tody 1986, 1993) and calculated the astrometric transformations to convert pixel coordinates to right ascension and declination using the 2MASS Point Source Catalogue (Cutri et al. 2003) as the frame of reference. For each frame, an initial astrometric transformation was fitted and then stars showing larger proper motions were discarded to obtain the final astrometric transformation. The number of astrometric reference stars varies betwen 50 and 100. Errors in coordinates were estimated after averaging the diferences between calculated positions of reference stars and their 2MASS coordinates. We determined the parallax and proper motion using the method described in Dupuy & Liu (2012), although we did not perform a Markov chain Monte Carlo analysis. We calculated the coordinates of Earth relative to the solar system barycentre with the NOVAS routine (Kaplan et al. 2012). We performed a least-squares fitting of both the proper motion and parallactic motion using the MPFIT routine (Markwardt 2009). We obtained a parallax of π = 0.228 ± 0.024 arcsec and a proper motion in each direction of μαcosδ = 1.954 ± 0.002 arcsec/yr and μδ = −0.330 ± 0.003 arcsec/yr (Table 1; Fig. 5). To check the consistency of this result we computed the parallax using several subsets of epochs from Table 3, and obtained similar estimations. Our parallax measurement translates into a mean distance of 4.4 pc. More data with new seeing-limited resolutions are still required for a finer adjustment of the distance until the Gaia satellite4 provides us with exquisite parallax measurement.
Astrometry for 2M1540 from public catalogues and our own follow-up with the ESO NTT.
We find that our parallactic distance, 4.4 pc, is closer than the distance (~6 pc) reported by Kirkpatrick et al. (2014). We re-computed the parallax with the MPFIT routine using the values given in Table 7 of Kirkpatrick et al. (2014) and derived a parallax of 0.186±0.024 arcsec ( pc), instead of 0.165±0.041 arcsec (d = 6.06
 pc; Kirkpatrick et al. 2014). If we add our points from the NTT EFOSC2 epochs to the values of Kirkpatrick et al. (2014), we find a parallax of 0.208±0.020 arcsec (
 pc). The latter value is consistent with our previous determination. We find differences of up to 2 pc in the parallactic distances obtained by both groups, suggesting that the error bars derived by the groups might be under-estimated if they have to be consistent with each other. Despite this, the proper-motion measurements of Kirkpatrick et al. (2014) and ours are consistent whithin the 1σ the uncertainties quoted by the two groups.
4.2. Spectrophotometric distance
To estimate the spectroscopic distance of 2M1540, we selected the only two known M7 dwarf within 8 pc, as listed in Table 4 of Kirkpatrick et al. (2012): Gl 644C (VB 8) at d = 6.46 ± 0.03 pc (Oppenheimer et al. 2001; Zakhozhaj 1979; Boeshaar & Tyson 1985) with J = 9.776 ± 0.029 mag (Cutri et al. 2003) and LHS 3003 at d = 6.88 ± 0.16 pc (Reid & Cruz 2002; Jenkins et al. 2009b) with J = 9.965 ± 0.026 mag. Applying the standard transformation using those trigonometric parallaxes and infrared magnitudes for M6.5 (Kirkpatrick et al. 2012) and M7.5 dwarfs (Kirkpatrick & McCarthy 1994), we infer spectroscopic distances of 4.43 and 4.33
 pc using Gl 644C and LHS 3003, respectively. Taking the average of both estimates, we derive a spectroscopic distance of 4.38 (3.92–4.96) pc for 2M1540 from the J-band, which agrees with our parallax estimate. Hence, we do not find evidence for an equal-mass binary.
If, however, we consider a spectral type of M6.5, we derive a most probable range of 4.43–5.61 pc for the spectroscopic distance, using GJ 1111 and LHS 292 as M6.5 templates at 3.62±0.04 and 4.54±0.07 pc, respectively (van Leeuwen 2007; Kirkpatrick et al. 2012). If we use the K-band and consider an error of half a subtype on the spectral type, we derive a spectroscopic distance of 4.3 pc (1σ error). These distance estimates are within the error bars of our parallactic measurement.
We conclude that 2M1540 is the closest M7 dwarf to the Sun and the third of its subtype known within 8 pc. Following Table 4 of Kirkpatrick et al. (2012), 2M1540 would be among the 50 closest systems and would be between the 42th and 70rd place on the individual ranking taking into account the error bars on our parallax estimate. Our discovery and the recent anouncement of the closest brown dwarf to the Sun (Luhman 2013; Mamajek 2013; Kniazev et al. 2013; Burgasser et al. 2013; Boffin et al. 2014) as well as the T7.5 dwarf WISE J0521+1025 at 5.0±1.3 pc (Bihain et al. 2013) demonstrate that the census of stars and brown dwarfs within 5 pc is still incomplete.
5. Discussion
5.1. Physical properties of 2M1540
We have derived a spectral type for 2M1540 of M7 with an error of half a subtype in both the optical and near-infrared spectra. This corresponds to an effective temperature of 2621±100 K, adopting the temperature scale for field dwarfs from Dahn et al. (2002) and Golimowski et al. (2004). We have also inferred the luminosity of log L/L⊙ = −3.22 for 2M1540 from its 2MASS JHKs-band photometry, the bolometric correction from Dahn et al. (2002) and Golimowski et al. (2004), and our parallactic distance (
 ). We can estimate the mass of 2M1540 by comparison of the derived luminosity with predictions from theoretical models (Baraffe et al. 2003; Burrows et al. 1997) assuming an age of 1–10 Gyr. We derive a mass of 0.090 ± 0.010 M⊙, suggesting that 2M1540 is a very low-mass star, slightly above the hydrogen-burning mass limit.
The lack of a strong feature due to lithium at 670.82 nm sets lower limits on the age and mass of the M7 dwarf. An upper limit of 0.1–0.2 Å on the lithium pEW implies a depletion factor larger than 1000 for an M7 source, according to the lithium curves of growth published in Zapatero Osorio et al. (2002). Additionally, 2M1540 is older than the Pleiades because lithium has been consumed from its photosphere (M7 Pleiades dwarfs have lithium in their spectra, e.g. Rebolo et al. 1996; Martín et al. 1998; Stauffer et al. 1999). According to the lithium-depletion curves produced by Baraffe et al. (1998), 2M1540 is most likely older than ~600 Myr and has a mass higher than 0.06 M⊙, in agreement with our previous derivation by comparison of the estimated dwarf effective temperature and luminosity with evolutionary models.
5.2. Density of M7 dwarfs
From the 8 pc sample presented in Kirkpatrick et al. (2012), we observe that only three objects have spectral types in the M7–M8 range (vB 8, LHS 3003, and Gl 105 C) whose spectral types are estimated from broad band colours. Hence, the discovery of 2M1540 represents an increase of 25% in the number of these late M dwarfs known at distances closer than 8 pc from our Sun. Using these four objects, we derive a density of ρ = 1.9 ± 0.9 × 10⁻³ pc-3 for M7 dwarfs in this volume, where error bars are given by Poisson count statistics. We should take this value as a lower limit, because other similar objects might have been missed in previous searches. We also note that our discovery lies in the M7–M8 spectral range where the sample of Cruz et al. (2007) is highly incomplete because their colour cuts probably miss up to 40% of these ultracool dwarfs. These authors estimated a number of 26.7 M7 dwarfs (after correction for incompleteness of objects with J − Ks colours less than 1 mag) within 20 pc in 36% of the total sky area. These studies derived a density of 1.9–2.2 × 10⁻³ pc-3 for M7–M8 dwarfs, in agreement with our determination. Independent works by Kirkpatrick & McCarthy (1994) and Caballero et al. (2008) derived similar densities of ρ = 1.91 × 10⁻³ pc-3 for M7 dwarfs.
6. Summary and future work
Cross-matching the 2MASS and WISE public catalogues to identify high proper motion low-mass stars and brown dwarfs, we independently discovered 2M1540 that we classified spectroscopically as an M7±0.5 at ~4.4 pc. We provided a high-quality spectrum with moderate resolution. 2M1540 is the first M7 dwarf discovered within 5 pc and the third one within 8 pc. It is among the 50 nearest systems and among the 66 nearest stars.
This new M7 dwarf represents an ideal target for parallax follow-up, photometric variability studies, high-resolution spectroscopic follow-up to investigate the role of clouds on the atmospheres of ultracool dwarfs, study the membership to nearby moving groups, and search for low-mass companions by direct imaging or radial velocity techniques. This new discovery is the closest M7 dwarf in the sky, which makes it ideal to look for substellar and planetary-mass companions including transiting Earth-like planets with a network of small telescopes such as the Las Cumbres Observatory Global network (LCOGT; Brown et al. 2013) or radial velocity variations at optical and/or infrared wavelengths with existing instruments such as ESO 3.6-/HARPS (Mayor et al. 2003) and VLT/CRIRES (Kaeufl et al. 2004).
The spectra used in this paper were downloaded from http://www.astro.washington.edu/users/slh/templates/data/
More information at http://www.sci.esa.int/gaia/
Acknowledgments
A.P.G. has been supported by Project No. 15345/PI/10 from the Fundación Séneca and the Spanish Ministry of Economy and Competitiveness (MINECO) under the grant AYA2010-21308-C03-03. N.L. was funded by the Ramón y Cajal fellowship number 08-303-01-02. This research has been supported by the Spanish Ministry of Economics and Competitiveness under the projects AYA2010-19136, AYA2010-21308-C3-02, AYA2010-21308-C03-03 and AYA2010-20535. M.T.R. acknowledges support by a grant from CONICYT and partial support from the Center for Astrophysics FONDAP and Proyecto Basal PB06 (CATA). This work is based on observations collected at the European Organisation for Astronomical Research in the Southern Hemisphere, Chile, under normal programme numbers 092.C-0229(A) and 092.C-0229(B) in visitor mode. This research has made use of the Simbad and Vizier databases, operated at the Centre de Données Astronomiques de Strasbourg (CDS), and of NASA’s Astrophysics Data System Bibliographic Services (ADS). This research has made use of the USNOFS Image and Catalogue Archive operated by the United States Naval Observatory, Flagstaff Station (http://www.nofs.navy.mil/data/fchpix/). This publication makes use of data products from the Two Micron All Sky Survey (2MASS), which is a joint project of the University of Massachusetts and the Infrared Processing and Analysis Center/California Institute of Technology, funded by the National Aeronautics and Space Administration and the National Science Foundation. This publication makes use of data products from the Wide-field Infrared Survey Explorer, which is a joint project of the University of California, Los Angeles, and the Jet Propulsion Laboratory/California Institute of Technology, funded by the National Aeronautics and Space Administration.
References
- Artigau, É., Radigan, J., Folkes, S., et al. 2010, ApJ, 718, L38 [NASA ADS] [CrossRef] [Google Scholar]
- Baraffe, I., Chabrier, G., Allard, F., & Hauschildt, P. H. 1998, A&A, 337, 403 [NASA ADS] [Google Scholar]
- Baraffe, I., Chabrier, G., Barman, T. S., Allard, F., & Hauschildt, P. H. 2003, A&A, 402, 701 [NASA ADS] [CrossRef] [EDP Sciences] [Google Scholar]
- Bihain, G., Scholz, R.-D., Storm, J., & Schnurr, O. 2013, A&A, 557, A43 [NASA ADS] [CrossRef] [EDP Sciences] [Google Scholar]
- Biller, B. A., Kasper, M., Close, L. M., Brandner, W., & Kellner, S. 2006, ApJ, 641, L141 [NASA ADS] [CrossRef] [Google Scholar]
- Bochanski, J. J., West, A. A., Hawley, S. L., & Covey, K. R. 2007, AJ, 133, 531 [NASA ADS] [CrossRef] [Google Scholar]
- Bochanski, J. J., Hawley, S. L., Covey, K. R., et al. 2010, AJ, 139, 2679 [NASA ADS] [CrossRef] [Google Scholar]
- Boeshaar, P. C., & Tyson, J. A. 1985, AJ, 90, 817 [NASA ADS] [CrossRef] [Google Scholar]
- Boffin, H. M. J., Pourbaix, D., Muzic, K., et al. 2014, A&A, L4 [Google Scholar]
- Boyd, W. T., Jelinsky, P. N., Finley, D. S., et al. 1994, in EUV, X-Ray, and Gamma-Ray Instrumentation for Astronomy V, eds. O. H. Siegmund, & J. V. Vallerga, Proc. SPIE, 2280, 280 [Google Scholar]
- Brown, T. M., Baliber, N., Bianco, F. B., et al. 2013, PASP, 125, 1031 [NASA ADS] [CrossRef] [Google Scholar]
- Burgasser, A. J., Sheppard, S. S., & Luhman, K. L. 2013, ApJ, 772, 129 [NASA ADS] [CrossRef] [Google Scholar]
- Burrows, A., Marley, M., Hubbard, W. B., et al. 1997, ApJ, 491, 856 [NASA ADS] [CrossRef] [Google Scholar]
- Caballero, J. A., Burgasser, A. J., & Klement, R. 2008, A&A, 488, 181 [NASA ADS] [CrossRef] [EDP Sciences] [Google Scholar]
- Chen, Y.-P., Trager, S. C., Peletier, R. F., et al. 2014, A&A, 565, A117 [NASA ADS] [CrossRef] [EDP Sciences] [Google Scholar]
- Cruz, K. L., & Reid, I. N. 2002, AJ, 123, 2828 [NASA ADS] [CrossRef] [Google Scholar]
- Cruz, K. L., Reid, I. N., Kirkpatrick, J. D., et al. 2007, AJ, 133, 439 [NASA ADS] [CrossRef] [Google Scholar]
- Cushing, M. C., Vacca, W. D., & Rayner, J. T. 2004, PASP, 116, 362 [NASA ADS] [CrossRef] [Google Scholar]
- Cushing, M. C., Rayner, J. T., & Vacca, W. D. 2005, ApJ, 623, 1115 [NASA ADS] [CrossRef] [Google Scholar]
- Cushing, M. C., Kirkpatrick, J. D., Gelino, C. R., et al. 2011, ApJ, 743, 50 [NASA ADS] [CrossRef] [Google Scholar]
- Cutri, R. M., Skrutskie, M. F., van Dyk, S., et al. 2003, 2MASS All Sky Catalog of point sources, VizieR On-line Data Catalog: II/246 [Google Scholar]
- Dahn, C. C., Harris, H. C., Vrba, F. J., et al. 2002, AJ, 124, 1170 [NASA ADS] [CrossRef] [Google Scholar]
- Deacon, N. R., Hambly, N. C., Henry, T. J., et al. 2005, AJ, 129, 409 [NASA ADS] [CrossRef] [Google Scholar]
- Dupuy, T. J., & Kraus, A. L. 2013, Science, 341, 1492 [NASA ADS] [CrossRef] [Google Scholar]
- Dupuy, T. J., & Liu, M. C. 2012, ApJS, 201, 19 [NASA ADS] [CrossRef] [Google Scholar]
- Golimowski, D. A., Leggett, S. K., Marley, M. S., et al. 2004, AJ, 127, 3516 [NASA ADS] [CrossRef] [Google Scholar]
- Hamuy, M., Walker, A. R., Suntzeff, N. B., et al. 1992, PASP, 104, 533 [NASA ADS] [CrossRef] [Google Scholar]
- Hawley, S. L., Covey, K. R., Knapp, G. R., et al. 2002, AJ, 123, 3409 [NASA ADS] [CrossRef] [Google Scholar]
- Henry, T. J., Jao, W.-C., Subasavage, J. P., et al. 2006, AJ, 132, 2360 [NASA ADS] [CrossRef] [Google Scholar]
- Høg, E., Fabricius, C., Makarov, V. V., et al. 2000, A&A, 355, L27 [NASA ADS] [Google Scholar]
- Holberg, J. B., Oswalt, T. D., & Sion, E. M. 2002, ApJ, 571, 512 [NASA ADS] [CrossRef] [Google Scholar]
- Houk, N. 1978, Michigan catalogue of two-dimensional spectral types for the HD stars (University of Microfilms International) [Google Scholar]
- Jenkins, J. S., Jones, H. R. A., Goździewski, K., et al. 2009a, MNRAS, 398, 911 [NASA ADS] [CrossRef] [Google Scholar]
- Jenkins, J. S., Ramsey, L. W., Jones, H. R. A., et al. 2009b, ApJ, 704, 975 [NASA ADS] [CrossRef] [Google Scholar]
- Kaeufl, H.-U., Ballester, P., Biereichel, P., et al. 2004, in Ground-based Instrumentation for Astronomy, eds. A. F. M. Moorwood, & M. Iye, Proc. SPIE, 5492, 1218 [Google Scholar]
- Kaplan, G., Bartlett, J. L., Monet, A., et al. 2012, NOVAS: Naval Observatory Vector Astrometry Software, Astrophysics Source Code Library, ascl:1202.003 [Google Scholar]
- Kasper, M., Biller, B. A., Burrows, A., et al. 2007, A&A, 471, 655 [NASA ADS] [CrossRef] [EDP Sciences] [Google Scholar]
- King, R. R., McCaughrean, M. J., Homeier, D., et al. 2010, A&A, 510, A99 [NASA ADS] [CrossRef] [EDP Sciences] [Google Scholar]
- Kirkpatrick, J. D., & McCarthy, D. W. 1994, AJ, 107, 333 [NASA ADS] [CrossRef] [Google Scholar]
- Kirkpatrick, J. D., Henry, T. J., & McCarthy, D. W. 1991, ApJS, 77, 417 [NASA ADS] [CrossRef] [Google Scholar]
- Kirkpatrick, J. D., Reid, I. N., Liebert, J., et al. 1999, ApJ, 519, 802 [NASA ADS] [CrossRef] [Google Scholar]
- Kirkpatrick, J. D., Cushing, M. C., Gelino, C. R., et al. 2011, ApJS, 197, 19 [NASA ADS] [CrossRef] [Google Scholar]
- Kirkpatrick, J. D., Gelino, C. R., Cushing, M. C., et al. 2012, ApJ, 753, 156 [NASA ADS] [CrossRef] [Google Scholar]
- Kirkpatrick, J. D., Schneider, A., Fajardo-Acosta, S., et al. 2014, ApJ, 783, 122 [NASA ADS] [CrossRef] [Google Scholar]
- Kniazev, A. Y., Vaisanen, P., Mužić, K., et al. 2013, ApJ, 770, 124 [NASA ADS] [CrossRef] [Google Scholar]
- Landolt, A. U. 1992, AJ, 104, 340 [NASA ADS] [CrossRef] [Google Scholar]
- Leggett, S. K., Saumon, D., Marley, M. S., et al. 2012, ApJ, 748, 74 [NASA ADS] [CrossRef] [Google Scholar]
- Lucas, P. W., Tinney, C. G., Burningham, B., et al. 2010, MNRAS, 108, L56 [NASA ADS] [CrossRef] [Google Scholar]
- Luhman, K. L. 2013, ApJ, 767, L1 [NASA ADS] [CrossRef] [Google Scholar]
- Mamajek, E. E. 2013 [arXiv:1303.5345] [Google Scholar]
- Markwardt, C. B. 2009, in Astronomical Data Analysis Software and Systems XVIII, eds. D. A. Bohlender, D. Durand, & P. Dowler, ASP Conf. Ser., 411, 251 [Google Scholar]
- Marsh, K. A., Wright, E. L., Kirkpatrick, J. D., et al. 2013, ApJ, 762, 119 [Google Scholar]
- Martin, C., & GALEX Team. 2005, in Maps of the Cosmos, eds. M. Colless, L. Staveley-Smith, & R. A. Stathakis, IAU Symp., 216, 221 [Google Scholar]
- Martín, E. L., Basri, G., Gallegos, J. E., et al. 1998, ApJ, 499, L61 [NASA ADS] [CrossRef] [Google Scholar]
- Martín, E. L., Delfosse, X., Basri, G., et al. 1999, AJ, 118, 2466 [NASA ADS] [CrossRef] [Google Scholar]
- Mayor, M., Pepe, F., Queloz, D., et al. 2003, The Messenger, 114, 20 [NASA ADS] [Google Scholar]
- McCaughrean, M. J., Close, L. M., Scholz, R.-D., et al. 2004, A&A, 413, 1029 [NASA ADS] [CrossRef] [EDP Sciences] [Google Scholar]
- Monet, D. G., Dahn, C. C., Vrba, F. J., et al. 1992, AJ, 103, 638 [NASA ADS] [CrossRef] [Google Scholar]
- Monet, D. G., Levine, S. E., Canzian, B., et al. 2003, AJ, 125, 984 [NASA ADS] [CrossRef] [Google Scholar]
- Oppenheimer, B. R., Golimowski, D. A., Kulkarni, S. R., et al. 2001, AJ, 121, 2189 [NASA ADS] [CrossRef] [Google Scholar]
- Oswalt, T. D., Hintzen, P. M., & Luyten, W. J. 1988, ApJS, 66, 391 [NASA ADS] [CrossRef] [Google Scholar]
- Rayner, J. T., Toomey, D. W., Onaka, P. M., et al. 2003, PASP, 115, 362 [NASA ADS] [CrossRef] [Google Scholar]
- Rayner, J. T., Cushing, M. C., & Vacca, W. D. 2009, ApJS, 185, 289 [NASA ADS] [CrossRef] [Google Scholar]
- Rebolo, R., Martín, E. L., Basri, G., Marcy, G. W., & Zapatero-Osorio, M. R. 1996, ApJ, 469, L53 [NASA ADS] [CrossRef] [Google Scholar]
- Reid, I. N., & Cruz, K. L. 2002, AJ, 123, 2806 [NASA ADS] [CrossRef] [Google Scholar]
- Reid, I. N., Hawley, S. L., & Gizis, J. E. 1995, AJ, 110, 1838 [NASA ADS] [CrossRef] [Google Scholar]
- Schmidt, S. J., West, A. A., Hawley, S. L., & Pineda, J. S. 2010, AJ, 139, 1808 [NASA ADS] [CrossRef] [Google Scholar]
- Scholz, R.-D., McCaughrean, M. J., Lodieu, N., & Kuhlbrodt, B. 2003, A&A, 398, L29 [NASA ADS] [CrossRef] [EDP Sciences] [Google Scholar]
- Skrutskie, M. F., Cutri, R. M., Stiening, R., et al. 2006, AJ, 131, 1163 [NASA ADS] [CrossRef] [Google Scholar]
- Smith, J. A., Tucker, D. L., Kent, S., et al. 2002, AJ, 123, 2121 [Google Scholar]
- Stauffer, J. R., Barrado y Navascués, D., Bouvier, J., et al. 1999, ApJ, 527, 219 [NASA ADS] [CrossRef] [Google Scholar]
- Teegarden, B. J., Pravdo, S. H., Hicks, M., et al. 2003, ApJ, 589, L51 [NASA ADS] [CrossRef] [Google Scholar]
- Tody, D. 1986, in Proc. SPIE Proc. 627, ed. D. L. Crawford, 733 [Google Scholar]
- Tody, D. 1993, in Astronomical Data Analysis Software and Systems II, eds. R. J. Hanisch, R. J. V. Brissenden, & J. Barnes, ASP Conf. Ser., 52, 173 [Google Scholar]
- Truemper, J. 1993, Science, 260, 1769 [NASA ADS] [CrossRef] [PubMed] [Google Scholar]
- van Leeuwen, F. 2007, A&A, 474, 653 [NASA ADS] [CrossRef] [EDP Sciences] [Google Scholar]
- Vernet, J., Dekker, H., D’Odorico, S., et al. 2011, A&A, 536, A105 [NASA ADS] [CrossRef] [EDP Sciences] [Google Scholar]
- West, A. A., Hawley, S. L., Walkowicz, L. M., et al. 2004, AJ, 128, 426 [NASA ADS] [CrossRef] [Google Scholar]
- West, A. A., Morgan, D. P., Bochanski, J. J., et al. 2011, AJ, 141, 97 [NASA ADS] [CrossRef] [Google Scholar]
- Wright, E. L., Eisenhardt, P. R. M., Mainzer, A. K., et al. 2010, AJ, 140, 1868 [NASA ADS] [CrossRef] [Google Scholar]
- York, D. G., Adelman, J., Anderson, J. E., et al. 2000, AJ, 120, 1579 [Google Scholar]
- Zakhozhaj, V. A. 1979, Vestnik Khar’kovskogo Universiteta, 190, 52 [NASA ADS] [Google Scholar]
- Zapatero Osorio, M. R., Béjar, V. J. S., Pavlenko, Y., et al. 2002, A&A, 384, 937 [NASA ADS] [CrossRef] [EDP Sciences] [Google Scholar]
All Tables
Coordinates, optical, and infrared photometry from public databases and our own measurements, along with our parallax and proper motion measurements and physical properties derived for 2M1540.
Pseudo-equivalent widths (pEW) of lines and doublets measured in the VLT/X-shooter spectrum of 2M1540.
Astrometry for 2M1540 from public catalogues and our own follow-up with the ESO NTT.
All Figures
|
Fig. 1 Images of the new M dwarf: from left to right are shown the optical images from the Digital Sky Survey (DSS IR; 10 April 1982), the near-infrared J-band from 2MASS (5 July 1999), and the mid-infrared 4.5 micron image from WISE (24 February 2010), and our NTT EFOSC2 image (4 October 2013) to illustrate the motion and colours of 2M1540. Each image is ~2 arcmin aside with north up and east to the left. |
| In the text | |
|
Fig. 2 Low-resolution (R ~ 500) optical (600–1000 nm) and near-infrared (900–2500 nm) spectra of 2M1540 (red lines) obtained with EFOSC2 (left) and SofI (right) on the NTT, respectively. We normalised the optical and near-infrared spectra at 750 and 1650 nm, respectively. Plotted in black below the optical spectrum of 2M1540 are three spectral template corrected for telluric absorptions (red line) from the SDSS spectroscopic database with spectral types bracketing our target (M6.5, M7, and M7.5; Bochanski et al. 2007). Plotted in black below the near-infrared spectrum of 2M1540 are spectral templates from the IRTF spectral library: Gl 406 (M6), GJ 1111 (M6.5; Kirkpatrick et al. 1991, 2012; Jenkins et al. 2009a), and Gl 644C (Zakhozhaj 1979; Boeshaar & Tyson 1985; Kirkpatrick et al. 2012). |
| In the text | |
|
Fig. 3 VLT/X-shooter spectrum of 2M1540 covering the UVB, VIS, and NIR wavelength range, from 400 to 2500 nm at a resolution of 4000−6800. The spectrum has been corrected for telluric absorption. |
| In the text | |
|
Fig. 4 Zoom on some specific regions of the VLT/X-shooter spectrum of 2M1540: from left to right, Hα at 656.3 nm, lithium at 670.8 nm, potassium around 770 nm, and sodium at ~819 nm and ~2200 nm. |
| In the text | |
|
Fig. 5 Parallactic motion for 2M1540. Proper motion produced by the fitting has been removed for clarity. |
| In the text | |
Current usage metrics show cumulative count of Article Views (full-text article views including HTML views, PDF and ePub downloads, according to the available data) and Abstracts Views on Vision4Press platform.
Data correspond to usage on the plateform after 2015. The current usage metrics is available 48-96 hours after online publication and is updated daily on week days.
Initial download of the metrics may take a while.