Fig. 2
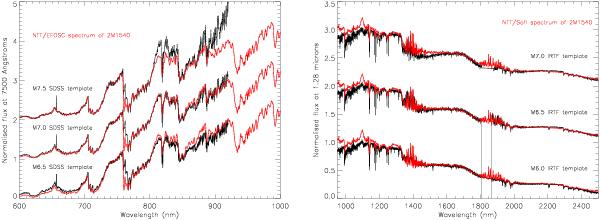
Low-resolution (R ~ 500) optical (600–1000 nm) and near-infrared (900–2500 nm) spectra of 2M1540 (red lines) obtained with EFOSC2 (left) and SofI (right) on the NTT, respectively. We normalised the optical and near-infrared spectra at 750 and 1650 nm, respectively. Plotted in black below the optical spectrum of 2M1540 are three spectral template corrected for telluric absorptions (red line) from the SDSS spectroscopic database with spectral types bracketing our target (M6.5, M7, and M7.5; Bochanski et al. 2007). Plotted in black below the near-infrared spectrum of 2M1540 are spectral templates from the IRTF spectral library: Gl 406 (M6), GJ 1111 (M6.5; Kirkpatrick et al. 1991, 2012; Jenkins et al. 2009a), and Gl 644C (Zakhozhaj 1979; Boeshaar & Tyson 1985; Kirkpatrick et al. 2012).
Current usage metrics show cumulative count of Article Views (full-text article views including HTML views, PDF and ePub downloads, according to the available data) and Abstracts Views on Vision4Press platform.
Data correspond to usage on the plateform after 2015. The current usage metrics is available 48-96 hours after online publication and is updated daily on week days.
Initial download of the metrics may take a while.