Fig. 3
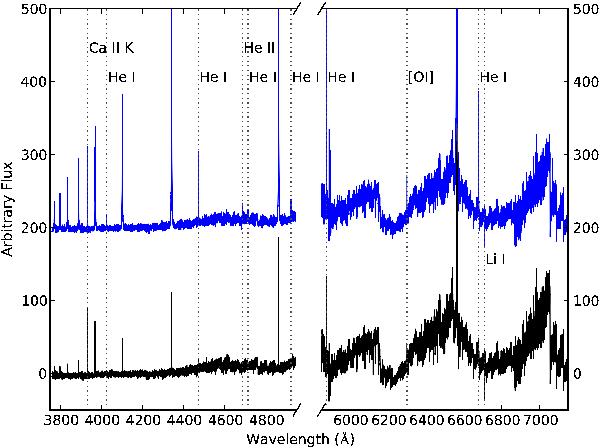
VLT-UVES spectra for LDS 5606A (top) and LDS 5606B (bottom), smoothed and arbitrarily scaled for clarity. Many prominent emission lines are evident, particularly for LDS 5606A. Emission from the core of the Na-D double at 5890 Å and 5896 Å, and Ca II H at 3968Å (blended with Hϵ at 3970 Å) is not labeled. All other strong, unlabeled emission lines are from the Hydrogen Balmer series, which can be seen to extend from n = 3 (Hα) to n = 11. Expanded portions of this spectrum highlighting a variety of spectral features, including comparison with portions of the HIRES spectra, appear in Zuckerman et al. (2014).
Current usage metrics show cumulative count of Article Views (full-text article views including HTML views, PDF and ePub downloads, according to the available data) and Abstracts Views on Vision4Press platform.
Data correspond to usage on the plateform after 2015. The current usage metrics is available 48-96 hours after online publication and is updated daily on week days.
Initial download of the metrics may take a while.