Fig. 7
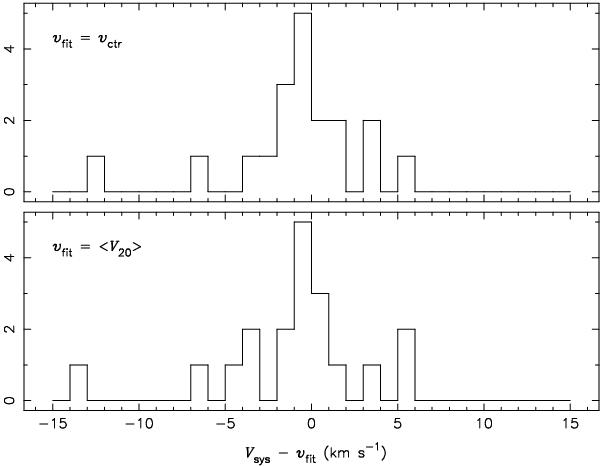
Frequency histograms of the difference between values of systemic velocity from two different sources. The first value, Vsys, is that given in Col. 6 of Table 2 of de Blok et al. (2008). These values were derived from tilted-ring fits to rotation curves of a 19-member subset of THINGS galaxies. The second value, vfit, was calculated in the present work. In the upper panel, the line centre parameter vctr of the fitted profile was used for vfit; in the lower panel, vfit is the mean of the low and high velocity values at the 20% height level on the fitted profile.
Current usage metrics show cumulative count of Article Views (full-text article views including HTML views, PDF and ePub downloads, according to the available data) and Abstracts Views on Vision4Press platform.
Data correspond to usage on the plateform after 2015. The current usage metrics is available 48-96 hours after online publication and is updated daily on week days.
Initial download of the metrics may take a while.