Fig. 6
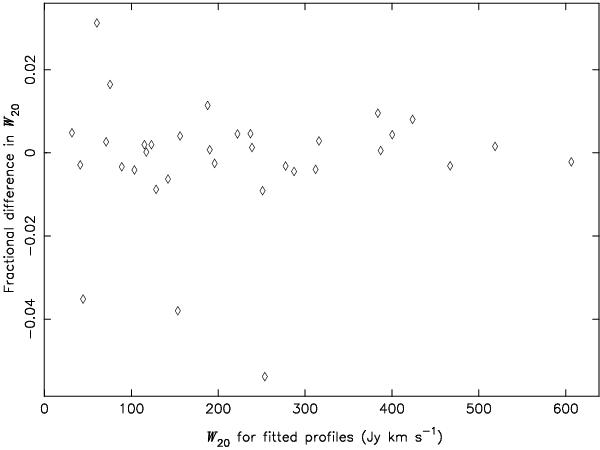
Comparison of the linewidth W20,data at the 20% height estimated from the observed THINGS spectral line to W20,fit, the same value for the profile fitted in the present paper to that line. The fractional linewidth difference was calculated from the expression 2(W20,fit − W20,data) / (W20,fit + W20,data). Values for W20,fit are given in Col. 10 of Table 1, and the fractional difference itself is given in Col. 11.
Current usage metrics show cumulative count of Article Views (full-text article views including HTML views, PDF and ePub downloads, according to the available data) and Abstracts Views on Vision4Press platform.
Data correspond to usage on the plateform after 2015. The current usage metrics is available 48-96 hours after online publication and is updated daily on week days.
Initial download of the metrics may take a while.