Free Access
Fig. 2
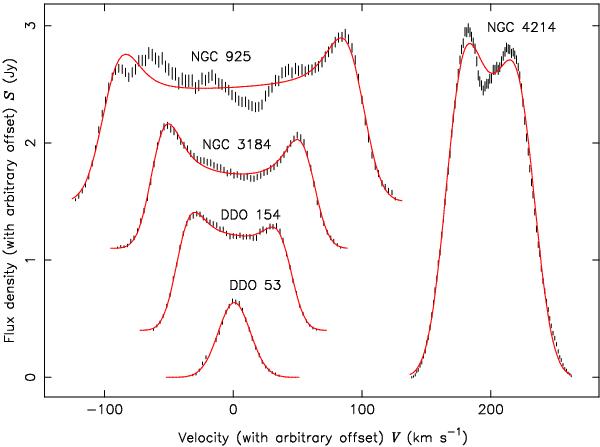
Fitted profiles (red curves) compared to raw data (black error bars) for 5 of the THINGS galaxies. Widths and heights of the profiles have not been altered but arbitrary offsets to both flux density and velocity have been added for clarity of plotting.
Current usage metrics show cumulative count of Article Views (full-text article views including HTML views, PDF and ePub downloads, according to the available data) and Abstracts Views on Vision4Press platform.
Data correspond to usage on the plateform after 2015. The current usage metrics is available 48-96 hours after online publication and is updated daily on week days.
Initial download of the metrics may take a while.