Fig. 9
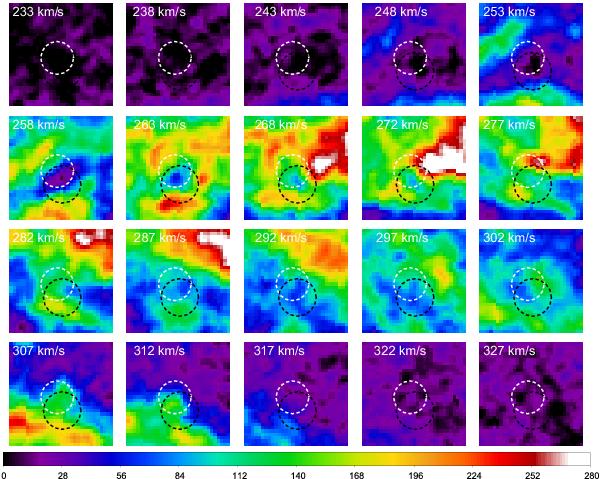
H i data cube channel maps showing the H i distribution for a certain heliocentric velocity interval. Each panel is created out of three velocity slices, corresponding to a velocity interval of ~5 km s-1 from top left to bottom right. The upper left panel starts with a mean heliocentric velocity of ~233 km s-1, the last panel in the lower right with ~327 km s-1. The dashed black circle marks the position of the SNR, while the dashed white circle corresponds to the Hα cavity. Each image shows an area of  , which is also indicated by the box in Fig. 8. Scales represent the brightness temperature and are in kelvin.
Current usage metrics show cumulative count of Article Views (full-text article views including HTML views, PDF and ePub downloads, according to the available data) and Abstracts Views on Vision4Press platform.
Data correspond to usage on the plateform after 2015. The current usage metrics is available 48-96 hours after online publication and is updated daily on week days.
Initial download of the metrics may take a while.