Fig. 8
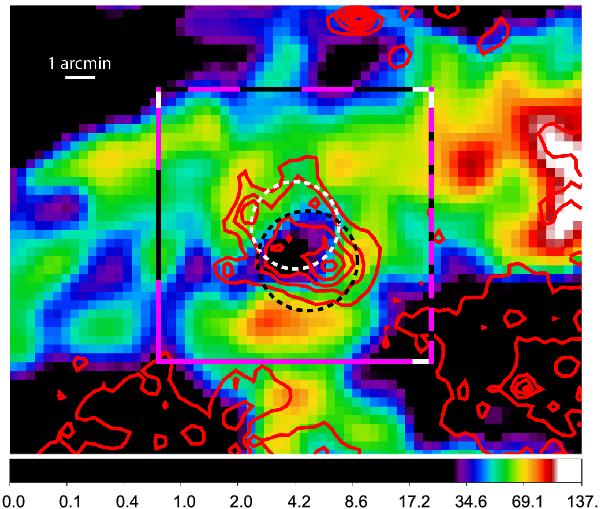
Combined ATCA and Parkes H i 21 cm radio data showing a velocity slice at ~264 km s-1 in the region of 22′ × 17′ around DEM L299 with overlaid X-ray contours of Fig. 2. Scales represent the brightness temperature and are in kelvin. The data have been smoothed by a Gaussian using a kernel radius of two pixels. The dashed black circle indicates the approximate size and position of the SNR based on the [S ii]/Hα ratio, while the dashed white circle marks the position of the Hα cavity. The box indicates the area that we used to create the images in Fig. 9 at different heliocentric velocities and the position–velocity images shown in Fig. 10. The different line styles of the box mark its individual sides and their orientation (white mark), for an easier comparison with the plots shown in Fig. 10.
Current usage metrics show cumulative count of Article Views (full-text article views including HTML views, PDF and ePub downloads, according to the available data) and Abstracts Views on Vision4Press platform.
Data correspond to usage on the plateform after 2015. The current usage metrics is available 48-96 hours after online publication and is updated daily on week days.
Initial download of the metrics may take a while.