Fig. 7
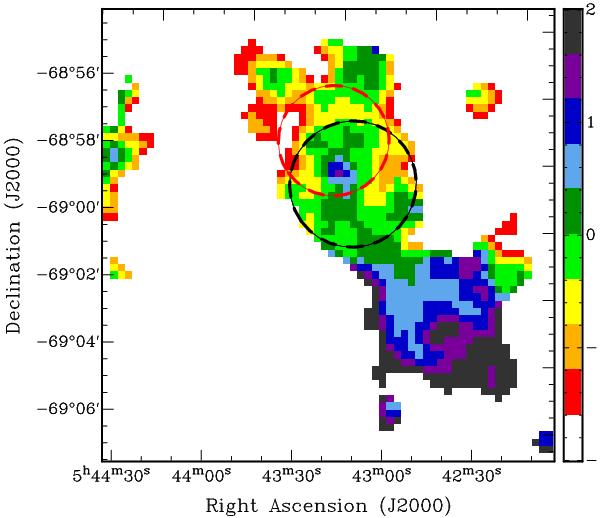
Spectral index map of the DEM L299 region created out of the 20 cm and 36 cm images. The position of the SNR and of the superbubble are marked in black and red (white in other figures). DEM L299 can be easily distinguished from the H ii region LHA 120-N 164, which lies to the south-west of it, because of their different spectral indices.
Current usage metrics show cumulative count of Article Views (full-text article views including HTML views, PDF and ePub downloads, according to the available data) and Abstracts Views on Vision4Press platform.
Data correspond to usage on the plateform after 2015. The current usage metrics is available 48-96 hours after online publication and is updated daily on week days.
Initial download of the metrics may take a while.