Fig. 6
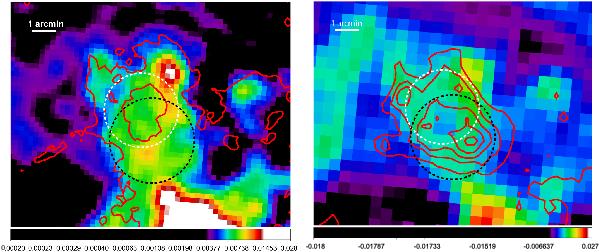
Left: 20 cm radio-continuum image of DEM L299 with overlaid Hα contours, showing the same area of  as the X-ray images in Fig. 2. The image was smoothed with a Gaussian using a kernel radius of one pixel. The contours are taken from the Hα image in Fig. 3 with one contour level at 2. The dashed black circle indicates the position of the SNR, while the dashed white circle shows the position of the superbubble. The scales are in Jy/beam. Right: same as left, but for the 36 cm radio-continuum data and with the same X-ray contours as in Fig. 3.
Current usage metrics show cumulative count of Article Views (full-text article views including HTML views, PDF and ePub downloads, according to the available data) and Abstracts Views on Vision4Press platform.
Data correspond to usage on the plateform after 2015. The current usage metrics is available 48-96 hours after online publication and is updated daily on week days.
Initial download of the metrics may take a while.