Fig. 5
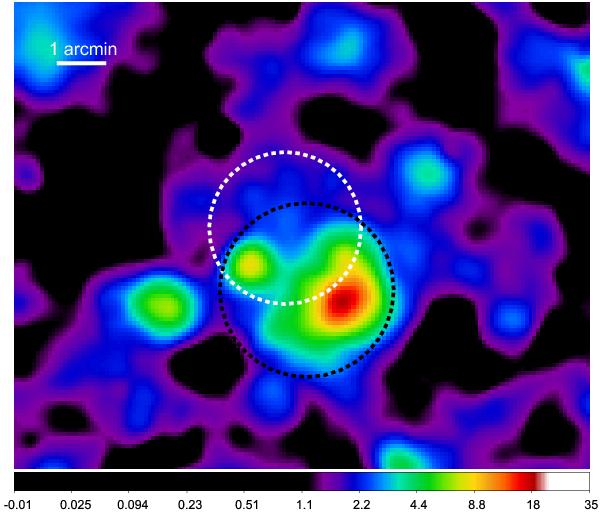
Intensity-scaled X-ray image of DEM L299 in an energy range of 1.5–4.5 keV. The dashed black circle indicates the position and size of the SNR as indicated through the [S ii]/Hα flux ratio image (Fig. 4), and the dashed white circle the superbubble as indicated through the optical images (Fig. 3). Most of the hard X-ray emission is confined inside the SNR region. Area of the sky, scale units, and smoothing parameters are the same as in Fig. 2.
Current usage metrics show cumulative count of Article Views (full-text article views including HTML views, PDF and ePub downloads, according to the available data) and Abstracts Views on Vision4Press platform.
Data correspond to usage on the plateform after 2015. The current usage metrics is available 48-96 hours after online publication and is updated daily on week days.
Initial download of the metrics may take a while.