Fig. 3
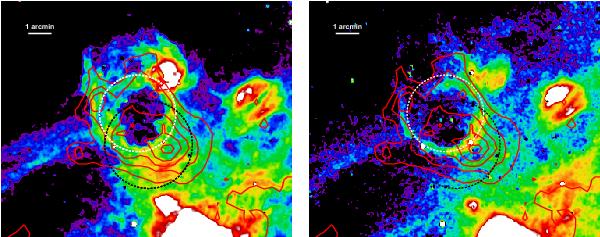
MCELS images in Hα (left) and [O iii] (right). The images are continuum-subtracted, flux-calibrated, sky-subtracted, and smoothed. The same area of the sky is shown as in the X-ray images in Fig. 2. The contours are taken from the smoothed X-ray broadband image, with 5 contour levels at 18, 28.5, 39, 49.5, and 60 counts/s/deg2. The dashed white circle shows the position of the Hα cavity, and the dashed black circle the position of the shell in the [S ii]/Hα image (see Fig. 4).
Current usage metrics show cumulative count of Article Views (full-text article views including HTML views, PDF and ePub downloads, according to the available data) and Abstracts Views on Vision4Press platform.
Data correspond to usage on the plateform after 2015. The current usage metrics is available 48-96 hours after online publication and is updated daily on week days.
Initial download of the metrics may take a while.