Fig. 2
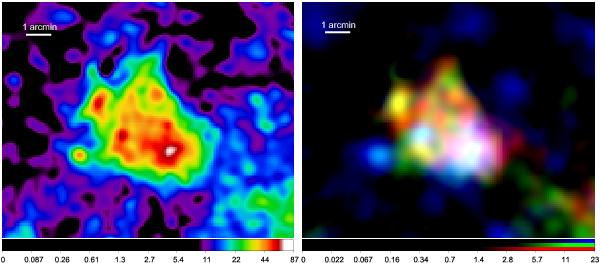
Left: intensity-scaled broadband XMM-Newton X-ray image of DEM L299. The image shows an area of  in the energy range of 0.3–8.0 keV and has been smoothed by a Gaussian with a kernel radius of four pixels, after being adaptively smoothed. Right: three-colour image created out of XMM-Newton data. Red: 0.3–0.8 keV, green: 0.8–1.5 keV, blue: 1.5–4.5 keV. To create the image, the same area, the same kernel radius, and the same scale units were used as for the broadband image. The scales are in counts/s/deg2.
Current usage metrics show cumulative count of Article Views (full-text article views including HTML views, PDF and ePub downloads, according to the available data) and Abstracts Views on Vision4Press platform.
Data correspond to usage on the plateform after 2015. The current usage metrics is available 48-96 hours after online publication and is updated daily on week days.
Initial download of the metrics may take a while.