Fig. 15
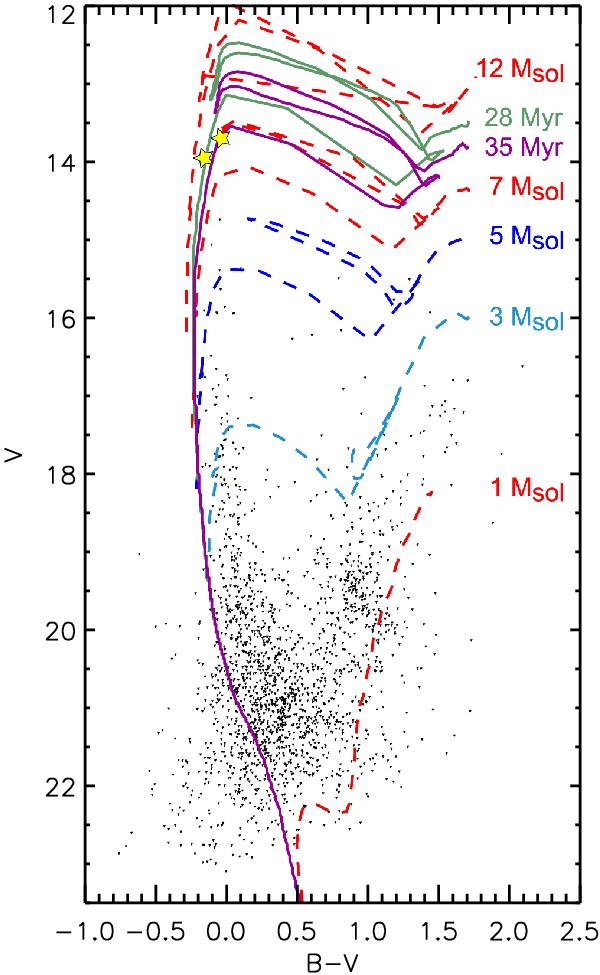
Colour–magnitude diagram for stars projected 2′ around the centre of the superbubble. Plotted are ~1900 stars from the photometric catalogue of Zaritsky et al. (2004). The dashed lines show the evolutionary tracks for stars with 1, 3 (light blue), 5 (dark blue), 7 and 12 M⊙ (marked in red if not stated differently, from bottom to top). The two most massive stars are marked with yellow star symbols. Two isochrones at 28 Myr (green) and 35 Myr (purple), which are taken from Lejeune & Schaerer (2001), are plotted as solid curves.
Current usage metrics show cumulative count of Article Views (full-text article views including HTML views, PDF and ePub downloads, according to the available data) and Abstracts Views on Vision4Press platform.
Data correspond to usage on the plateform after 2015. The current usage metrics is available 48-96 hours after online publication and is updated daily on week days.
Initial download of the metrics may take a while.