Fig. 14
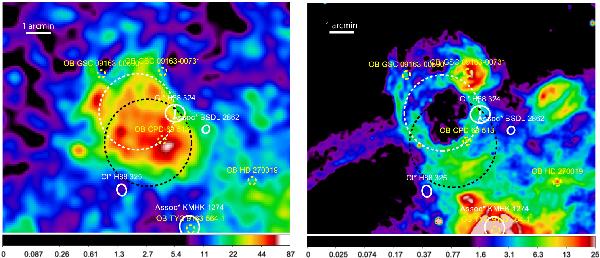
Stellar population in the DEM L299 region. Shown are OB-stars (dashed yellow small circles), clusters and associations of stars (white circles). The position of the remnant and of the superbubble are marked with a black and a dashed white circles. The images show the region in the broadband (0.3–8 keV) X-ray (left) and in the Hα light (right). To create the images, the same parameters as in Figs. 2, left side, and 3, left side, have been used. Scales of the left image are in units of counts/s/deg2, while the scales on the right side are in 10-15 erg/cm2/s. The population study has been performed with SIMBAD.
Current usage metrics show cumulative count of Article Views (full-text article views including HTML views, PDF and ePub downloads, according to the available data) and Abstracts Views on Vision4Press platform.
Data correspond to usage on the plateform after 2015. The current usage metrics is available 48-96 hours after online publication and is updated daily on week days.
Initial download of the metrics may take a while.