Fig. 13
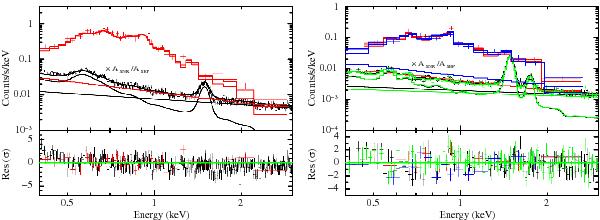
Fitted source and background spectra for the SNR for pn (left) and MOS1/2 (right) with residuals in the energy range of 0.4–3.0 keV. The component for the SNR emission was fitted with a vpshock model. The straight lines are the modelled residual soft proton components for the corresponding detector and observation. Crosses stand for data points, while the solid lines are the fitted models. The source spectra are plotted in red (pn and MOS1) or blue (MOS2) and the background spectra in black (pn and MOS1) or green (MOS2). For better presentation, the background spectra are scaled down to the area of the SNR region, which was much smaller than the extraction region for the SEP spectrum.
Current usage metrics show cumulative count of Article Views (full-text article views including HTML views, PDF and ePub downloads, according to the available data) and Abstracts Views on Vision4Press platform.
Data correspond to usage on the plateform after 2015. The current usage metrics is available 48-96 hours after online publication and is updated daily on week days.
Initial download of the metrics may take a while.