Fig. 12
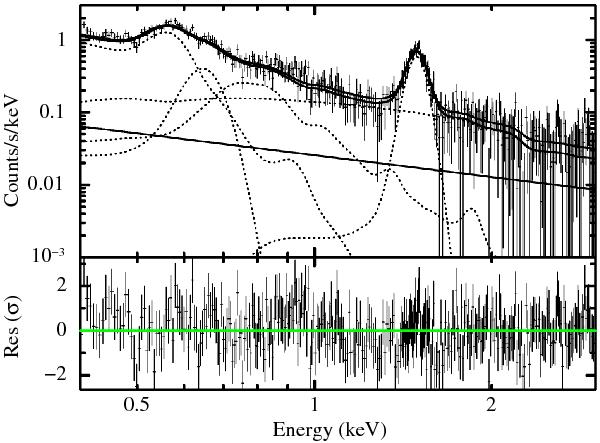
Fitted pn spectrum of the SEP observation used for estimating the local X-ray background in an energy range of 0.4–3.0 keV with model components and residuals. This spectrum has been fitted simultaneously with the SNR spectrum shown in Fig. 13. The straight line is the modelled residual soft proton component. Crosses are data points, while the solid line shows the fitted model. The model components are dotted.
Current usage metrics show cumulative count of Article Views (full-text article views including HTML views, PDF and ePub downloads, according to the available data) and Abstracts Views on Vision4Press platform.
Data correspond to usage on the plateform after 2015. The current usage metrics is available 48-96 hours after online publication and is updated daily on week days.
Initial download of the metrics may take a while.