Fig. 10
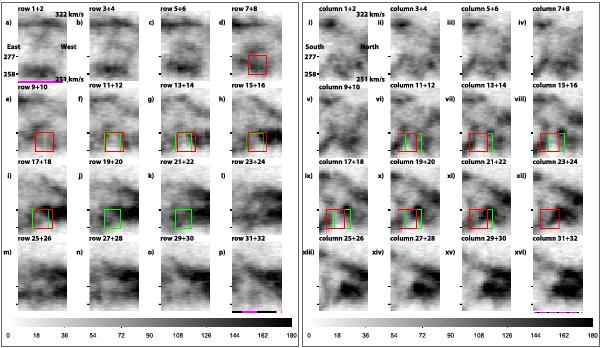
Average H i distribution image of the DEM L299 region at a certain position (left: east-west direction, right: south-north direction) for a velocity range of 251–322 km s-1. Left: position–velocity plot showing the intensity of the H i emission in dependence of the velocity (ordinate) of the gas within the box in Fig. 8 against its position (abscissa) in the east-west direction of that box. The ordinate shows the velocity in the range of 251 km s-1 (at the bottom of each plot) to 322 km s-1 (at the top of each plot), with a velocity resolution of 1.649 km s-1. The abscissa covers a range of 10.́3 in east-west direction, corresponding to ~150 pc at the LMC distance. The different plots show from a) to p) the velocity information for two added pixel rows of the box in Fig. 8, as indicated above each plot. These pixel rows are taken from the box of Fig. 8 from bottom to top. Since the abscissa of panel a) corresponds to the lowest two pixel rows of the box in Fig. 8, both are marked with a magenta line of the same line style (here: solid), also indicating their orientation through a white bar, for an easier comparison of these plots with Fig. 8. The same holds for panel p). The red rectangle indicates the position of the SNR as indicated by the [S ii]/Hα flux ratio, while the green rectangle shows the position of the Hα central cavity. The velocity range of these rectangles corresponds to 258–277 km s-1, as determined for the SNR and the superbubble in Fig. 9. This velocity range is marked in the plots by two black tick marks. Scales are in kelvin. Right: same as left, but for the south-north direction of the box in Fig. 8, i.e. for the different pixel columns of the box (stepped from left to right) instead of pixel rows.
Current usage metrics show cumulative count of Article Views (full-text article views including HTML views, PDF and ePub downloads, according to the available data) and Abstracts Views on Vision4Press platform.
Data correspond to usage on the plateform after 2015. The current usage metrics is available 48-96 hours after online publication and is updated daily on week days.
Initial download of the metrics may take a while.