Fig. 1
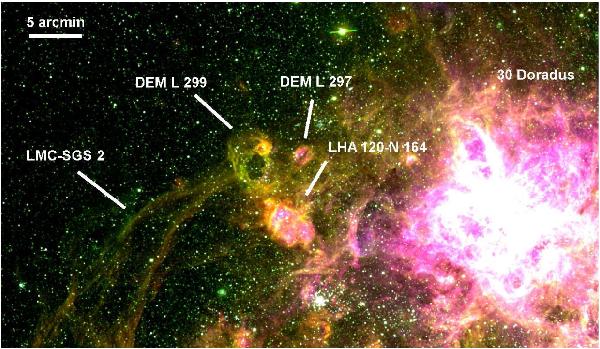
Region around DEM L299 in the LMC with DEM L299 visible as a cavity, lying north-east of emission region LHA 120-N 164 and east of DEM L297. Parts of the supergiant shell LMC-SGS 2 can be seen as filaments in the eastern part of the image, while 30 Doradus is visible as a bright emission region in the west. The image is created out of MCELS data and is a three-colour image showing the Hα emission in red, [S ii] emission in green, and [O iii] emission in blue. The whole image shows an area of 60 × 34′ (~870 pc × 500 pc). North is approximately in the upward direction, east is to the left.
Current usage metrics show cumulative count of Article Views (full-text article views including HTML views, PDF and ePub downloads, according to the available data) and Abstracts Views on Vision4Press platform.
Data correspond to usage on the plateform after 2015. The current usage metrics is available 48-96 hours after online publication and is updated daily on week days.
Initial download of the metrics may take a while.