Fig. 9
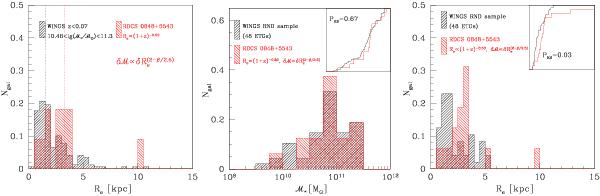
Left: same as right panel of Fig. 8 but considering only the 11 ETGs of the RDCS0848 cluster in the (non-evolved) mass range 2 × 10¹¹−1.5 × 10¹¹ M⊙. The distribution of the effective radius of these 11 cluster ETGs evolved to z = 0 according to mass and effective radius evolution is compared with the distribution of local WINGS ETGs selected in the same range of evolved stellar masses. Central: the stellar mass distribution of one of the 100 random sample extracted from the WINGS sample is compared with distribution of the 16 ETGs. Right: the effective radius distribution of the random sample shown in the central panel is compared with the distribution of the 16 ETGs.
Current usage metrics show cumulative count of Article Views (full-text article views including HTML views, PDF and ePub downloads, according to the available data) and Abstracts Views on Vision4Press platform.
Data correspond to usage on the plateform after 2015. The current usage metrics is available 48-96 hours after online publication and is updated daily on week days.
Initial download of the metrics may take a while.