Fig. 7
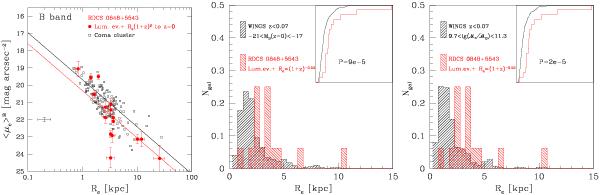
Effects of a pure size evolution of the form Re ∝ (1 + z)b with b = − 0.53 applied to the 16 cluster ETGs at z = 1.27. In the left panel the resulting Kormendy relation evolved to z = 0 (red filled circles and red line) is compared to the local one (black line). The middle and right panels are similar to the lower panels of Fig. 5: they show the distributions of the evolved effective radii of the 16 ETGs (red histogram) and of the WINGS galaxies selected in the same luminosity range (−21 <MB< −17; left panel) and stellar mass range (5 × 10¹⁰ M⊙< ℳ∗< 2 × 10¹¹ M⊙; right). The effective radii have been computed using GASPHOT as for the WINGS sample.
Current usage metrics show cumulative count of Article Views (full-text article views including HTML views, PDF and ePub downloads, according to the available data) and Abstracts Views on Vision4Press platform.
Data correspond to usage on the plateform after 2015. The current usage metrics is available 48-96 hours after online publication and is updated daily on week days.
Initial download of the metrics may take a while.