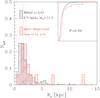
Fig. 5
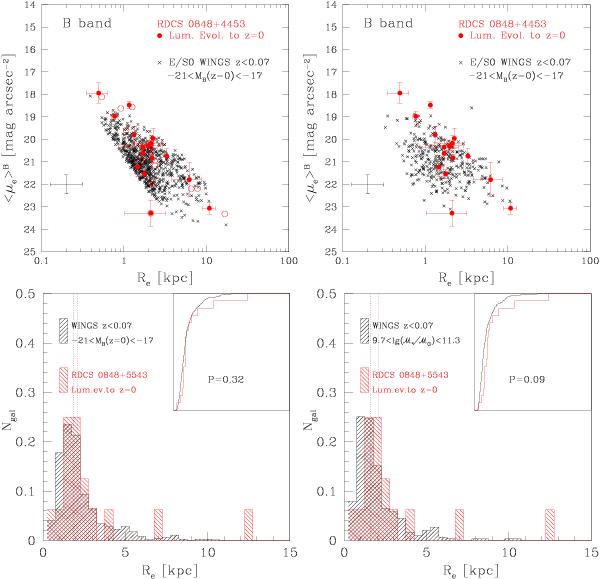
Upper panels: size–surface brightness relation in the rest-frame B-band. Red circles are our 16 cluster ellipticals evolved to z = 0. Filled circles represent the values obtained using GASPHOT, consistently with the WINGS sample, while open circles are the values derived using GALFIT. Crosses are local cluster ellipticals selected from the WINGS sample in the same absolute magnitude range (−21 < MB < −17, left panel) of the 16 galaxies evolved to z = 0 and in the same stellar mass range (5 × 10¹⁰ M⊙ < ℳ∗ < 2 × 10¹¹ M⊙, right panel). Lower panels: the distributions of the effective radius of the 16 ETGs at z = 1.27 (red histogram) and of the WINGS galaxies selected according to the luminosity (left) and stellar mass (right) criteria are shown and compared using the K-S test. In the small insets the cumulative distributions are shown together with the probability that they belong to the same parent populations. Effective radii have been computed using the same procedures for the high-z and the low-z samples (see text).
Current usage metrics show cumulative count of Article Views (full-text article views including HTML views, PDF and ePub downloads, according to the available data) and Abstracts Views on Vision4Press platform.
Data correspond to usage on the plateform after 2015. The current usage metrics is available 48-96 hours after online publication and is updated daily on week days.
Initial download of the metrics may take a while.