Fig. 4
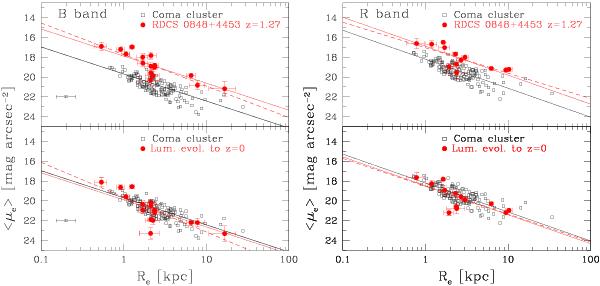
Kormendy relation in the rest-frame B band (left panel) and R band (right panel). Red filled symbols are our 16 cluster ellipticals at z = 1.27 (upper panels) and evolved to z = 0 (lower panels) according to the passive luminosity evolution as described in Sect. 5.1 and reported in Table 4. The red lines are the Kormendy relation reported in Table 5 obtained by fitting Eq. (4) to our 16 ellipticals assuming the slope β at z = 0 (solid line) and leaving β as free parameter (dashed line). The open squares are the sample of early-type galaxies in the Coma cluster studied by Jørgensen et al. (1995a). The black lines represent the Kormendy relation at z = 0 derived from this sample and reported in Eqs. (7) and (8).
Current usage metrics show cumulative count of Article Views (full-text article views including HTML views, PDF and ePub downloads, according to the available data) and Abstracts Views on Vision4Press platform.
Data correspond to usage on the plateform after 2015. The current usage metrics is available 48-96 hours after online publication and is updated daily on week days.
Initial download of the metrics may take a while.