Fig. 2
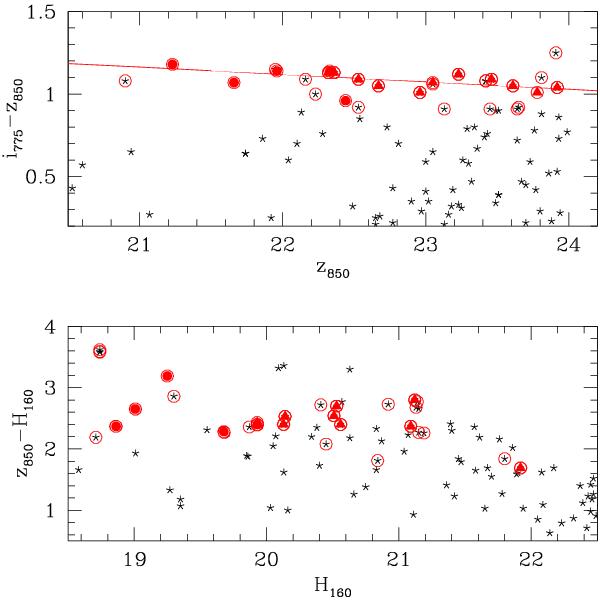
Color–magnitude relation. The i775 − z850 (upper panel) and the z850 − H160 (lower panel) colors of the selected ETGs galaxies (red filled symbols) as a function of z850 (16 galaxies) and of H160 (15 galaxies) are shown together with those of the 105 galaxies (black crosses) covered by NICMOS observations. The five ETGs with spectroscopic redshift are marked by red filled circles and the remaining 11 ETGs cluster members are marked by red filled triangles. Red open circles mark all the galaxies selected in the color range 0.9 < i775 − z850 < 1.3. The solid red line in the upper panel is the color–magnitude relation (i775 − z850) = 2.1 − 0.044z850 best-fitting the 16 ellipticals.
Current usage metrics show cumulative count of Article Views (full-text article views including HTML views, PDF and ePub downloads, according to the available data) and Abstracts Views on Vision4Press platform.
Data correspond to usage on the plateform after 2015. The current usage metrics is available 48-96 hours after online publication and is updated daily on week days.
Initial download of the metrics may take a while.