Fig. 1
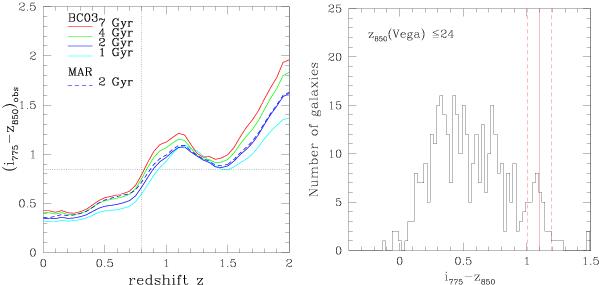
i775 − z850 color of galaxies. Left: the expected i775 − z850 color of galaxies is shown as a function of redshift for 4 different ages. The different solid lines refer to (from top to bottom) 7 Gyr old (red line), 4 Gyr old (green line), 2 Gyr old (blue line), and 1 Gyr old (cyan line). The dashed line refers to a 2 Gyr old template obtained with the Maraston (2005) models. The color is always i775 − z850 < 0.8 (horizontal black line) for redshift z < 0.8, and it is always larger than 0.8 for z > 0.8, this independently of the age of the stellar population considered. Right: the i775 − z850 color distribution of the 467 galaxies brighter than z850 < 24 falling within 1 Mpc from the cluster center is shown. The solid red line marks the mean color ⟨ i775 − z850 ⟩ = 1.1 ± 0.09 of the 5 ETGs cluster members spectroscopically identified by Stanford et al. (1997). The dashed lines represent ±1σ. A second peak is evident in the distribution at the mean color of the 5 ETGs.
Current usage metrics show cumulative count of Article Views (full-text article views including HTML views, PDF and ePub downloads, according to the available data) and Abstracts Views on Vision4Press platform.
Data correspond to usage on the plateform after 2015. The current usage metrics is available 48-96 hours after online publication and is updated daily on week days.
Initial download of the metrics may take a while.