Fig. 8
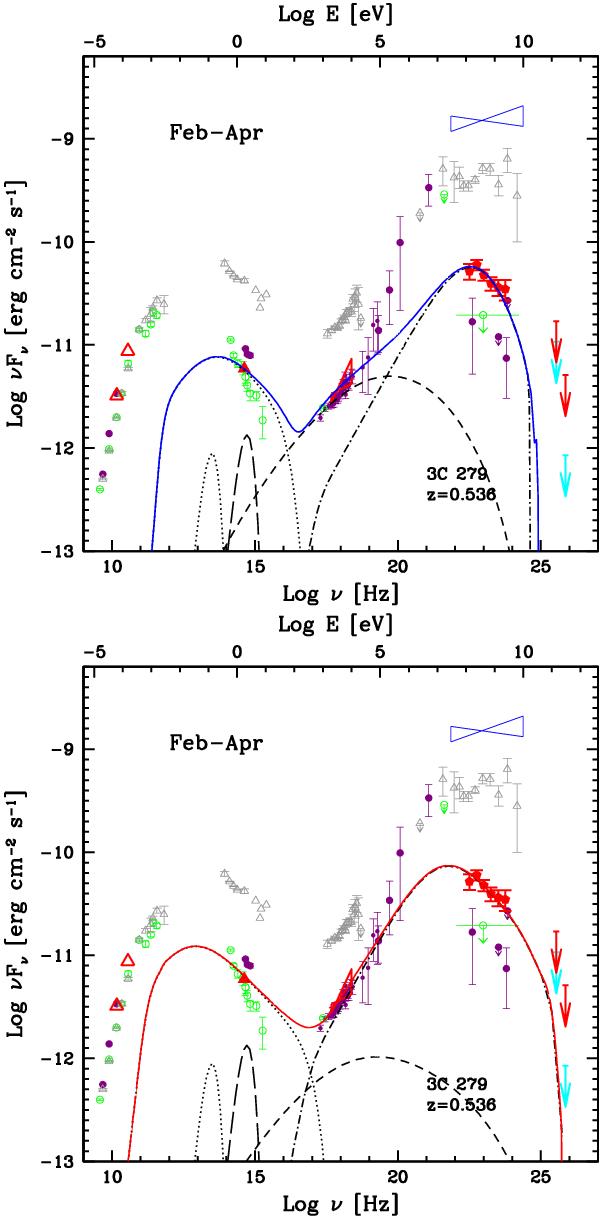
Multiwavelength observations between February and April 2011: radio from Metsähovi and OVRO (red open triangles), optical from KVA (red filled triangles), X-ray from RXTE (red bowtie), and HE γ-rays from Fermi-LAT (red circles) and MAGIC (red arrows: EBL corrected, cyan arrows: observed points). Historical data are also shown (Aleksić et al. 2011b): high-activity state from 1991 (grey open triangles, Hartman et al. 1996), low state from 1993 (green open circles, Maraschi et al. 1994; Ballo et al. 2002), the high-activity state from 1996 (blue bowtie, Wehrle et al. 1998), and the low-activity state from the end of 1996 to the beginning of 1997 (violet dots Hartman et al. 2001a). Only points marked in red are considered for the SED fit. The SED is fitted using two leptonic models, with different populations of external low-energy photons as target for the inverse Compton process. The individual components are shown: synchrotron (dotted), SSC (dashed), and EC (dot-dashed). The black-body radiation from the BLR (dashed) and from the infrared torus (dotted) are also shown. In the upper panel, the high-energy emission originates from a region located inside the BLR. In the lower panel, the high-energy emission comes from a region located outside the BLR, considering only photons from the infrared torus as targets for inverse Compton scattering. The parameters are summarised in Table 5.
Current usage metrics show cumulative count of Article Views (full-text article views including HTML views, PDF and ePub downloads, according to the available data) and Abstracts Views on Vision4Press platform.
Data correspond to usage on the plateform after 2015. The current usage metrics is available 48-96 hours after online publication and is updated daily on week days.
Initial download of the metrics may take a while.