Fig. 4
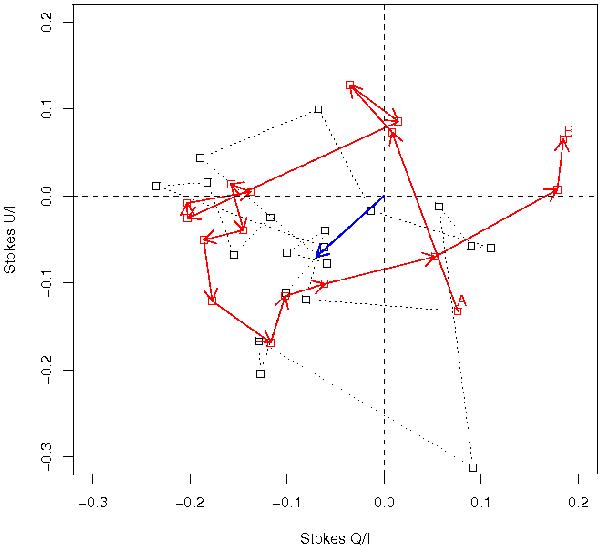
Stokes plane of the polarisation data, where each coordinate axis represents one of the orthogonal components of the linearly polarised light. The distance to the coordinate centre is the polarisation degree. Since the polarisation is a pseudo-vector, with a π-ambiguity, the reported values for the EVPA rotations correspond to half-angles in the Stokes plane. Open boxes show the KVA and RINGO2 polarisation data for 3C 279, from February to June 2011: the grey boxes are from the period prior to optical flare, while the red open boxes are from the time of optical flare (starting ~MJD 55 700). The lines (grey dotted for pre-flare epoch and red arrows for flare epoch) connect the points in chronological order. The blue vector marks the average direction and magnitude of the polarisation of the source measured during the campaign.
Current usage metrics show cumulative count of Article Views (full-text article views including HTML views, PDF and ePub downloads, according to the available data) and Abstracts Views on Vision4Press platform.
Data correspond to usage on the plateform after 2015. The current usage metrics is available 48-96 hours after online publication and is updated daily on week days.
Initial download of the metrics may take a while.