Fig. 3
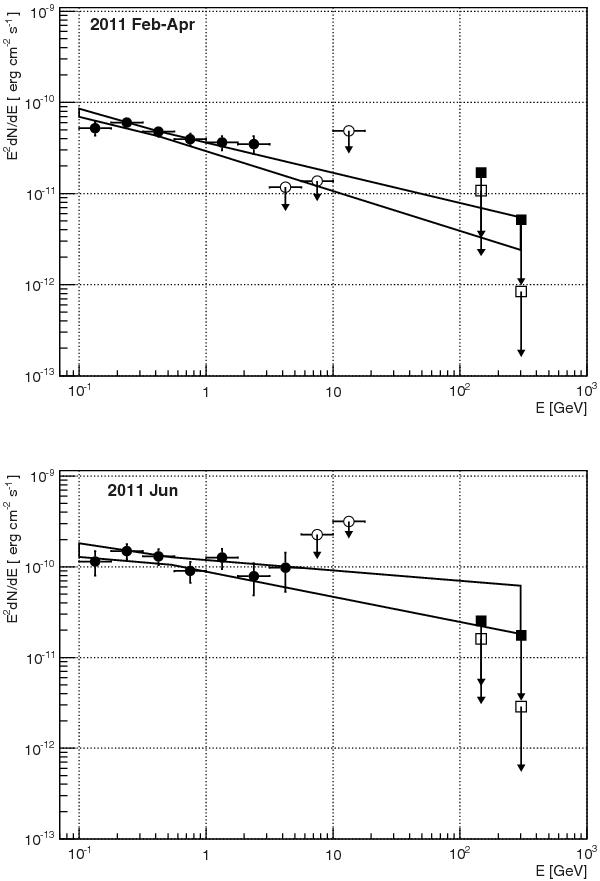
Comparison of Fermi-LAT observations and MAGIC upper limits for 2011 February–April (top) and 2011 June (bottom) observations. The butterfly represents the SED plot with a 1σ confidence region of the best-fit power-law model extended up to 300 GeV for Fermi-LAT observations (filled circles, empty circles represent upper limits). The VHE data (open squares) are corrected for EBL absorption (filled squares) using Domínguez et al. (2011).
Current usage metrics show cumulative count of Article Views (full-text article views including HTML views, PDF and ePub downloads, according to the available data) and Abstracts Views on Vision4Press platform.
Data correspond to usage on the plateform after 2015. The current usage metrics is available 48-96 hours after online publication and is updated daily on week days.
Initial download of the metrics may take a while.