Fig. 11
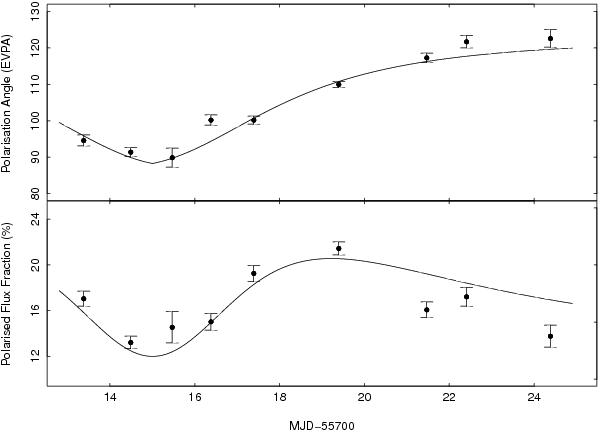
Fit of the bent trajectory model to the polarisation quantities at the dates corresponding to the optical flare. Both the observed polarisation degree and the percentage of polarised flux closely follow the behaviour predicted by the bent trajectory model (Fig. 10). The model, as described in the text, is obtained following the theory of Nalewajko (2010). After the epochs reported in the figure, the monitoring is less intense and the behaviour of the polarisation degree and EVPA seem to change and no longer follow the simple bent trajectory model.
Current usage metrics show cumulative count of Article Views (full-text article views including HTML views, PDF and ePub downloads, according to the available data) and Abstracts Views on Vision4Press platform.
Data correspond to usage on the plateform after 2015. The current usage metrics is available 48-96 hours after online publication and is updated daily on week days.
Initial download of the metrics may take a while.